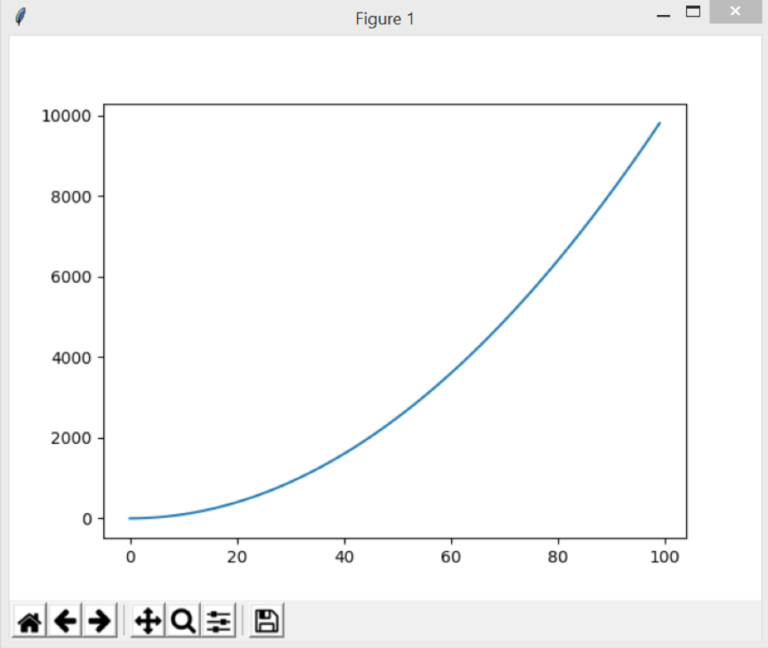
Data Visualization in Python using Simple Line Chart
In this article, we are going to use Python to visualize the data in a Simple Line Chart. Nowadays, the internet is being bombarded with a huge amount of data each second. According to the Sixth edition of Domo Inc. reports, over 2.5 quintillion bytes of data are generated each second. We can use the…