Debugging Realtime Database Performance with Firebase Database Profiler
Firebase Real-time database is built to handle high data traffic apps, but if you don’t architect your data properly you can run into problems such as slow queries, high database load and most of all expensive bandwidth. So happily, the Firebase developers built us a Database Profiler (firebase profiling) which helps us to understand what’s going on in the real-time database.
So, in order to use the database profiler, you need to first install Firebase CLI. The firebase database profiler is bundled as a part of Firebase CLI. There are three steps to run the database profiler.
1. Install Firebase Tools:
To install firebase tools open your windows command line terminal (Cmd) and type below command.
npm install --global firebase-tools
Note: To install firebase tools you first have to install npm first.
2. Login To Firebase:
After successfully installed the firebase tools you need to login to your firebase account. Type the below command to enter firebase credentials.
firebase login
After typing the command your default web browser will be opened and asked you to enter your firebase account credentials.
 3. Firebase Init:
Later the successful login you need to run the below command, to select on which firebase project you want to run the firebase database profiler.
Note: Before running the command make sure to create a different directory, navigate to that directory and then proceed.
firebase init
After entering the command, you need to verify the directory, select the Deploy Firebase Real-time Database Rules option and then select the firebase project which you need to debug.
4. Realtime Database Profiling:
So in order to profile the firebase real-time database. We need to run the below command to cmd.
firebase database:profile
Once we run the above command, the profiler is going to start requesting operations from your real-time database. The firebase database profiler will stream everything happens to each operation that’s going on to the firebase command line option(CLI).
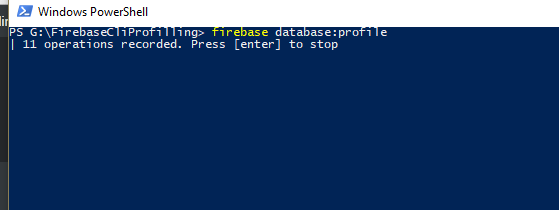
Whenever you feel like you’ve collected enough operations, you just press Enter. Once you hit Enter button the CLI is going to aggregate all of those operations into a report that’s easy for you to understand.
 Now the firebase CLI report is broken up into three sections.
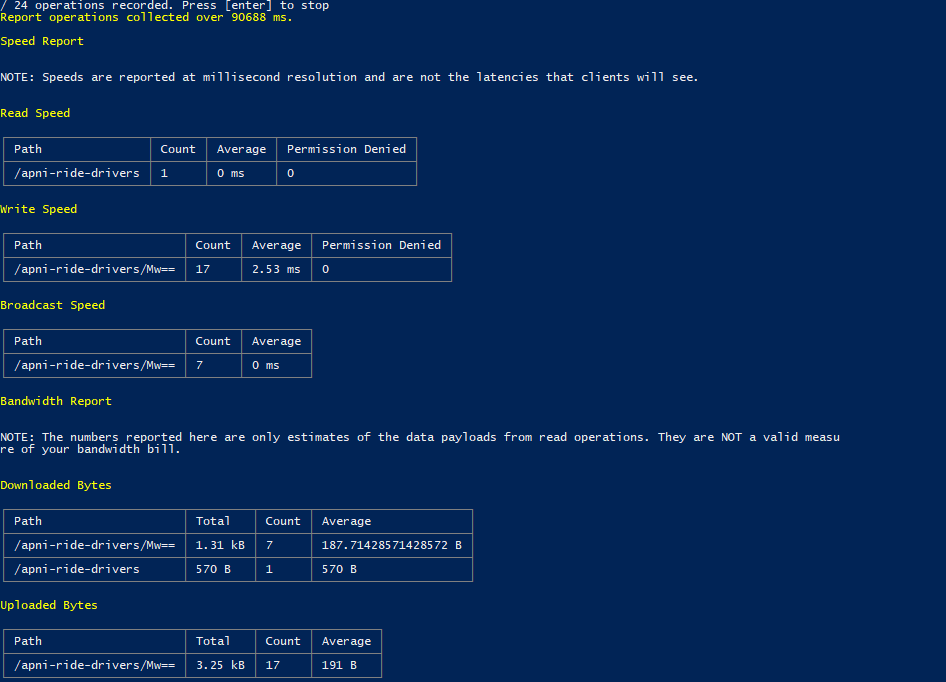
4.1 Speed Report:
The speed report is the first section and it’s broken down into the read, write and broadcast speed.
- Read & Write Speed: The read and write speed has four different columns. The Path column is for where data is written or from which Path data is reading. The Count is for how many times data has been reading or how many times written. Average column is the processing time and there’s also a column for Permission Denied, which lets you know if your security rules are misconfigured, or if you’ve apps that are making requests that they shouldn’t be.
- Broadcast Speed: The broadcast speed is the time that it takes after the initial query when data gets updated at a location, for the servers to process and send out those updates.
4.2 Bandwidth Report:
The bandwidth report is the next section and it is also broken down into two categories, bytes download from the server and bytes uploaded to the server.
- Downloaded Bytes: It corresponds to reads and updates sent from the server. The downloaded bytes also have four different columns. The Path column is for, from where the data has been downloaded, the Total column is for the size of data has been downloaded. The third one is Count, how many times data has been downloaded and the last column is Average for per download size.
- Uploaded Bytes: The uploaded bytes are written that the clients are making to the server. The uploaded bytes have the same column like downloaded bytes but they measure data on the basis of clients sending data to the server.
4.3 Unindexed Queries:
This unindexed query is the last section of the firebase database profiler report. Usually, this ends up being an empty section. However, if it’s not empty then you really need to draw attention to it. Unindexed queries are when our client SDKs, instead of relying on an index to query data the server sends all of the data to a client device. These will lead to a very expensive operation for you.
Note: The Real-time database SDK also gives you Unindexed query warning in the console.
Let’s say we’ve tested our database in development mode and launch the product if everything works. Now, what if I want to see how my database works in production mode. The good news is, the firebase database profiler is designed to run in production without any overhead. It’s safe to use in all production.
You see the firebase database profiler tools is very helpful for you to check which queries take more bandwidth, which queries takes more average time to read, how to increase read and write speed etc..
Alright, guys that were all for this article. If you’ve any queries regarding this post please do comment below.
Thank you for being here and keep reading…