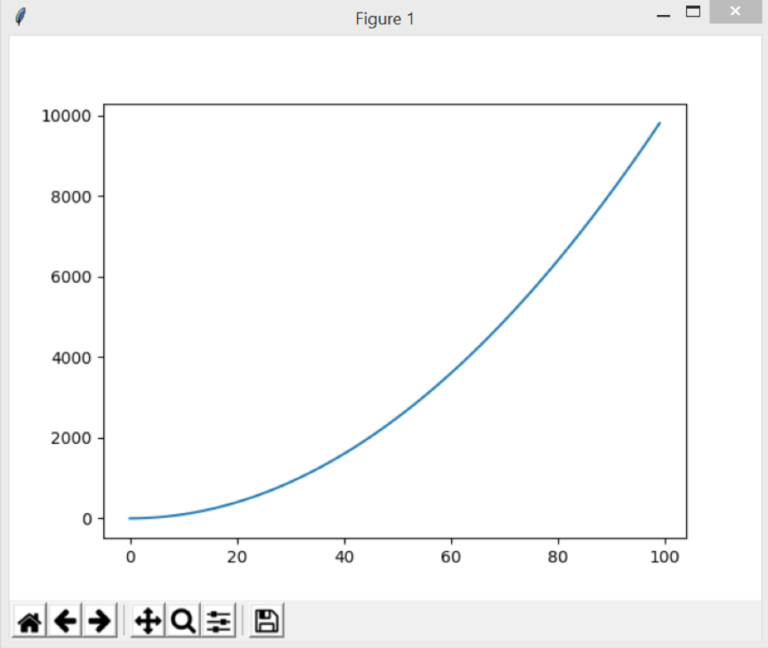
Data Visualizing from CSV Format to Chart using Python
| | |

Data Visualizing from CSV Format to Chart using Python

In this article, we will download a data set from an online resource and create a working visualization of that data. As we have discussed in the previous article, the internet is being bombarded by lots of data each second. An incredible amount and variety of data can be found online. The ability to analyze…

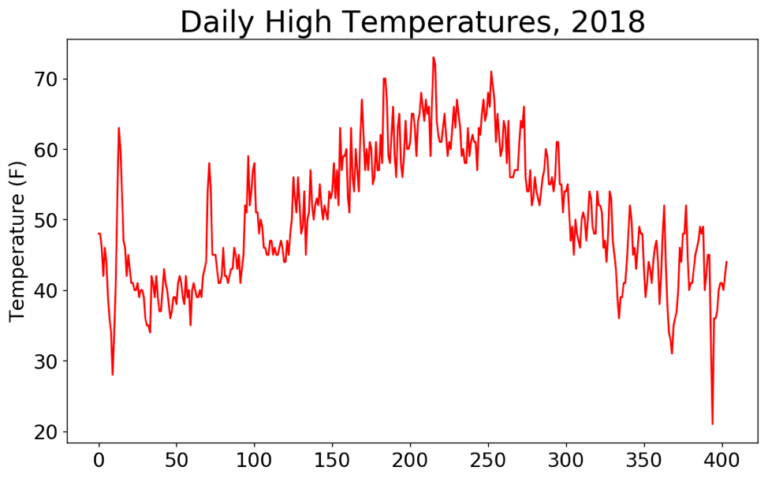
Data Visualization in Python using Simple Line Chart
| |

Data Visualization in Python using Simple Line Chart

In this article, we are going to use Python to visualize the data in a Simple Line Chart. Nowadays, the internet is being bombarded with a huge amount of data each second. According to the Sixth edition of Domo Inc. reports, over 2.5 quintillion bytes of data are generated each second. We can use the…