Linear Regression Using sklearn in Python
Linear regression is one of the simplest regression techniques in machine learning. In this article, we will discuss the basics of linear regression. Additionally, we will also implement linear regression using the sklearn module in Python.
What is Linear Regression in Machine Learning?
Linear regression is a regression technique that is used to find relationships between attributes of a dataset that are linearly related to each other.
If there are N independent variables namely X1, X2, X3, X4, X5 to XN and a dependent variable Y in a dataset, we need to find the coefficients A0 to AN of each independent variable such that A0+A1X1i+A2X2i+A3X3i+A4X4i+A5X5i+.....+ANXNi is closest to Yi for entry i in the dataset.
Generally, we use the least-squares method to minimize the error in prediction and fit a linear regression line.
Now that we have discussed the definition of linear regression, let us implement linear regression using the sklearn module in Python. First, we will implement simple linear regression in Python. After that, we will implement multiple regression.
Simple Linear Regression Using sklearn in Python
In simple linear regression, there is only one independent variable and a single dependent variable. For example, look at the following dataset.
| Weight | Height |
| 30 | 100 |
| 40 | 123 |
| 50 | 155 |
| 60 | 178 |
| 70 | 221 |
| 80 | ? |
Here, we have been given the height and weight of pillars. The weight of the pillar is an independent variable while the height is a dependent variable.
To implement simple linear regression using the sklearn module in Python for the above dataset, we will use the following steps.
- First, we will import the
LinearRegression()function from the sklearn module using theimportstatement. - Then, we will make a list of the weights of the pillar. Similarly, we will make a list of the heights of the pillar. Make sure that the weight and height at a particular position in both the lists belong to the same data entry.
- After creating the list, we will create a
LinearRegressionmodel. For this, we will use theLinearRegression()function. TheLinearRegression()function returns aLinearRegressionmodel after execution. - Once we create the
LinearRegressionmodel, we will fit our data into the linear regression model. For this, we will use thefit()method. Thefit()method takes the list containing independent variables as its first input argument and the list containing the dependent variable as its second input argument. - We will pass the list of weights as the first input argument and the list of heights as the second input argument to the
fit()method. After execution, thefit()method returns a fitted linear regression model. - To access the coefficient of the independent variable in the fitted linear regression model, you can use the
coef_attribute. - To access the constant term in the linear regression equation, you can use the
intercept_attribute of the linear regression model.
The entire program to implement simple linear regression using the sklearn module in Python is as follows.
from sklearn.linear_model import LinearRegression
import numpy
weights=numpy.array([30,40,50,60,70]).reshape(-1, 1)
heights=numpy.array([100,123,155,178,221]).reshape(-1, 1)
regression_model=LinearRegression()
regression_model.fit(weights,heights)
print("The Coefficients are:",regression_model.coef_)
print("The intercept is:",regression_model.intercept_)
Output:
The Coefficients are: [[2.97]]
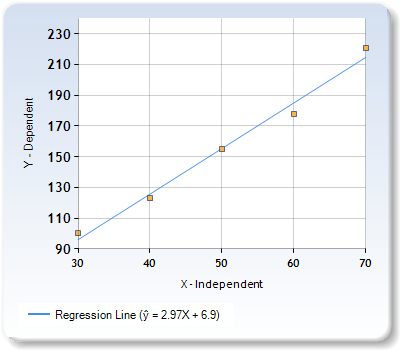
The intercept is: [6.9]Here, the coefficient is 2.97 and the intercept is 6.9. So, the equation of the linear regression line will be as follows.
height=weight*2.97+6.9The regression line looks as follows in a coordinate system. You can observe that the actual points may or may not be at the regression line. However, the regression line is always built in a way that errors can be minimized.
After creating the linear regression model, you can also predict the value of the dependent variable for any given independent variable. For this, you can use the predict() method.
The predict() method, when invoked on a linear regression model, accepts a list of independent variables as its input argument. After execution, it returns a list of predicted values for the dependent variable. Each value of the dependent variable corresponds to the independent variable at the same position in the input list.
You can use the predict() method to predict the value for the dependent variable for given independent variables as shown in the following example.
from sklearn.linear_model import LinearRegression
import numpy
weights=numpy.array([30,40,50,60,70]).reshape(-1, 1)
heights=numpy.array([100,123,155,178,221]).reshape(-1, 1)
regression_model=LinearRegression()
regression_model.fit(weights,heights)
input_weights=numpy.array([80,90,100]).reshape(-1, 1)
print("Input weights are:",input_weights)
output_heights= regression_model.predict(input_weights)
print("Predicted values for input weights are:",output_heights)
Output:
Input weights are: [[ 80]
 [ 90]
 [100]]
Predicted values for input weights are: [[244.5]
 [274.2]
 [303.9]]
Here, we have given the values 80, 90, and 100 as input weights. The predict() method returns the values 244.5, 274.2, and 303.9 as the predicted heights for the input weights respectively.
Multiple Regression Using the sklearn Module in Python
In multiple regression, we have multiple independent variables. For instance, consider the following dataset.
| Weight | Radius | Height |
| 30 | 5 | 100 |
| 40 | 7.8 | 123 |
| 50 | 9.9 | 155 |
| 60 | 12.7 | 178 |
| 70 | 14.6 | 221 |
| 80 | 16 |
Here, weight and radius of the pillars are independent variables while the height is the dependent variable.
In the cases where we have two or more independent variables, we use the following steps to implement multiple regression using the sklearn module in python.
- If there are N independent variables namely X1, X2, X3, X4, X5 to XN in the dataset. Each independent variable will have its own list. In the lists of independent variables, the elements at the same position in each list correspond to the same entry in the dataset.
- From the list of independent variables, we will create a list of tuples where each tuple contains N elements. The tuple at position i in the dataset should contain the values X1i, X2i, X3i, X4i, X5i, ….., XNi. Thus, the tuple at position i in the list of tuples will represent the ith entry in the dataset.
- To create the list of tuples from the lists of each attribute, we will use the
zip()method. Thezip()method will take each list X1, X2, X3, X4, X5 till XN as its input argument. After execution, it will return the list of tuples. - Once we get the list of tuples, we will use it as the vector containing independent variables. Hence, we will pass the list of tuples as the first input argument to the
fit()method. Subsequently, we will pass the list of dependent variables as the second input argument to thefit()method. - After execution, the
fit()method will return the trained linear regression model. You can find the coefficients and intercept of the linear regression line using thecoef_attribute and theintercept_attribute respectively as shown below.
from sklearn.linear_model import LinearRegression
import numpy
weights=[30,40,50,60,70]
radii=[5,7.8,9.9,12.7,14.6]
inputs=list(zip(weights,radii))
heights=numpy.array([100,123,155,178,221]).reshape(-1, 1)
regression_model=LinearRegression()
regression_model.fit(inputs,heights)
print("The Coefficients are:",regression_model.coef_)
print("The intercept is:",regression_model.intercept_)
Output:
The Coefficients are: [[  8.10913242 -21.32420091]]
The intercept is: [-36.81461187]
Here, the coefficients are 8.10913242 and -21.32420091 and the intercept is -36.81461187. Therefore, the equation of the regression line will be as follows.
height=weight*8.10913242- radius*21.32420091-36.81461187To predict the values for a given tuple of independent variables, you can use the predict() method as shown in the following example.
from sklearn.linear_model import LinearRegression
import numpy
weights=[30,40,50,60,70]
radii=[5,7.8,9.9,12.7,14.6]
inputs=list(zip(weights,radii))
heights=numpy.array([100,123,155,178,221]).reshape(-1, 1)
regression_model=LinearRegression()
regression_model.fit(inputs,heights)
input_values=[(80,16),(90,18.5)]
print("The input values are:",input_values)
output_values=regression_model.predict(input_values)
print("The output values are:",output_values)
Output:
The input values are: [(80, 16), (90, 18.5)]
The output values are: [[270.72876712]
 [298.50958904]]
Here, we have given (80,16) and (90,18.5) as inputs for height and radius of the pillars. Here, 80 and 90 are heights of the pillars and 16 and 18.5 are respective radius.
After execution, the predict() method returns the values 270.72876712 and 298.50958904 as heights of the input values.
Uses of Linear Regression
Linear regression is one of the simplest algorithms to create machine learning applications for the prediction of various real-life metrics.
- In supply chain management, linear regression can be used to implement demand forecasting.
- In finance, linear regression can be used to predict stock prices. Banks can use regression algorithms to predict if a loan will be paid by a customer or not.
- In marketing, you can use linear regression to predict the success or failure of a campaign.
- Linear regression is used in different areas in applications like time series analysis.
You can see that linear regression can be used in almost every aspect of the business. By using linear regression models, we can uncover patterns and relationships in the data that can be used to leverage monetary benefits for the business. With forecasting, a business can always predict the demand for its products in a particular area and prepare for the same. This automatically signifies the importance of linear regression in machine learning.
Suggested Reading: Login page in Asp.net Core MVC with Database.
Assumptions of Linear Regression
With simplicity comes drawbacks. Linear regression is simple but it assumes that the dataset is of a certain feature. Let us look at the assumptions of the linear regression algorithms.
- First of all, linear regression assumes that the independent variables and dependent variables are linearly related. If the dataset contains data that does not have a linear relationship between the dependent variables and the independent variable, the linear regression model will give highly inaccurate results.
- The linear regression algorithm also assumes that the independent variables in the dataset aren’t highly correlated. If the independent variables are highly correlated, the accuracy of the machine learning model will become low. While data cleaning, you need to prepare the data in such a way that the attributes aren’t highly correlated.
- Linear regression algorithms can only handle numeric data. Therefore, you need to make sure that the dataset contains only numeric values. If the dataset originally contains categorical values, you need to annotate the data while data preprocessing to make the data numeric in nature.
- The dataset used in creating a linear regression model must be free of outliers. Outliers highly affect a linear regression model making the prediction results highly inaccurate.
- The dependent variable in the dataset should have a normal distribution for each independent variable. Additionally, the variance of the distribution of the target variable is desired to be constant for all the independent variables.
Tips For Building a Better Linear Regression Model
Following are the tips to build a machine learning model for linear regression with high accuracy.
- As we are building a regression line, a dataset with continuous data attributes such as length, time, weight, etc will give better results.
- Before building a regression model, you should first check each independent variable has a linear relationship with the dependent variable. To verify this, you can simply plot and visualize a scatter plot for each independent variable and the dependent variable.
- You should also perform correlation analysis to check if the independent variables are highly correlated or not. If two independent variables are highly correlated, you can choose to drop one variable from the dataset.
- While data cleaning, you should remove the outliers in the dataset for the linear regression model to perform better.
- After implementing the linear regression model, you should verify that the errors have a normal distribution along the best-fit regression line. Additionally, the variance along the regression line should remain constant throughout the linear regression line.
Conclusion
In this article, we have discussed the basics of linear regression, its importance, assumptions, and tips to implement a linear regression model with high accuracy. We also implemented the linear regression and multiple regression algorithm using the sklearn module in Python.
I hope you enjoyed reading this article. To know more about machine learning, you can read this article on useful machine learning tools. You might also have a look at this article on how to create a chatbot in Python.