Elbow Method to Find Best K in K-Prototypes Clustering
In partition-based clustering algorithms, we face a major challenge in deciding the optimal number of clusters. In this article, we will discuss how we can find the best k in k-prototypes clustering using the elbow method while clustering mixed data types in Python.
What Is the K-Prototypes Clustering Algorithm?
The k-prototypes clustering algorithm is a partitioning-based clustering algorithm that we can use to cluster datasets having attributes of numeric and categorical types. This algorithm is an ensemble of the k-means clustering algorithm and the k-modes clustering algorithm. To understand the k-prototypes clustering algorithm in a better manner, you can read the following articles.
- K-Means clustering with a numerical example
- K-Means clustering using the sklearn module in Python
- K-modes clustering with a numerical example
- K-Modes clustering for categorical data in Python
- K-prototypes clustering with a numerical example
- Clustering mixed data types in python
K-Prototypes Clustering Implementation
To implement the k-prototypes clustering in python, we use the kprototypes module from the kmodes library in python. In kmodes.kprototypes module, we get the KPrototypes() function that we can use to create an untrained machine-learning model for k-prototypes clustering. After creating the model, we can use the fit(), fit_predict(), and predict() methods to perform clustering and prediction.
Following is the implementation of k-prototypes clustering in python. I have used the following dataset for clustering. It contains five attributes namely EQ Rating, IQ Rating, Gender, Height, and Weight.
| Student | EQ Rating | IQ Rating | Gender | Height(in cms) | Weight(in Kgs) |
| Student 1 | A | B | F | 155 | 53 |
| Student 2 | A | A | M | 174 | 70 |
| Student 3 | C | C | M | 177 | 75 |
| Student 4 | C | A | F | 182 | 80 |
| Student 5 | B | A | M | 152 | 76 |
| Student 6 | A | B | M | 160 | 69 |
| Student 7 | B | A | F | 175 | 55 |
| Student 8 | A | A | F | 181 | 70 |
| Student 9 | A | C | M | 180 | 85 |
| Student 10 | A | B | F | 166 | 54 |
| Student 11 | C | C | M | 162 | 66 |
| Student 12 | A | C | M | 153 | 74 |
| Student 13 | A | B | M | 160 | 62 |
| Student 14 | B | C | F | 169 | 59 |
| Student 15 | A | B | F | 171 | 71 |
Following is the code to implement k-prototypes clustering in Python.
#import modules
import pandas as pd
import numpy as np
from kmodes import kprototypes
#read data input
input_data=pd.read_csv("Kprototypes_dataset.csv")
print("The input data is:")
print(input_data)
df=input_data.copy()
#drop unnecessary columns
df.drop(columns=["Student"],inplace=True)
#Normalize dataset
df["Height(in cms)"]=(df["Height(in cms)"]/df["Height(in cms)"].abs().max())*5
df["Weight(in Kgs)"]=(df["Weight(in Kgs)"]/df["Weight(in Kgs)"].abs().max())*5
#obtain array of values
data_array=df.values
#specify data types
data_array[:, 0:3] = data_array[:, 0:3].astype(str)
data_array[:, 3:] = data_array[:, 3::].astype(float)
#create untrained model
untrained_model = kprototypes.KPrototypes(n_clusters=3,max_iter=20)
#predict clusters
clusters = untrained_model.fit_predict(data_array, categorical=[0, 1, 2])
input_data["Cluster labels"]=clusters
print("The clustered data is:")
input_data
Output:
The input data is:
Student    EQ Rating IQ Rating Gender  Height(in cms)  Weight(in Kgs)
Student 1         A         B      F             155              53
Student 2         A         A      M             174              70
Student 3         C         C      M             177              75
Student 4         C         A      F             182              80
Student 5         B         A      M             152              76
Student 6         A         B      M             160              69
Student 7         B         A      F             175              55
Student 8         A         A      F             181              70
Student 9         A         C      M             180              85
Student 10         A         B      F            166              54
Student 11         C         C      M            162              66
Student 12         A         C      M            153              74
Student 13         A         B      M            160              62
Student 14         B         C      F            169              59
Student 15         A         B      F            171              71

The clustered data is:
Student    EQ Rating IQ Rating Gender Height    Weight Cluster Labels
Student 1 	A 	B 	F 	155 	53 	2
Student 2 	A 	A 	M 	174 	70 	1
Student 3 	C 	C 	M 	177 	75 	0
Student 4 	C 	A 	F 	182 	80 	1
Student 5 	B 	A 	M 	152 	76 	0
Student 6 	A 	B 	M 	160 	69 	0
Student 7 	B 	A 	F 	175 	55 	2
Student 8 	A 	A 	F 	181 	70 	1
Student 9 	A 	C 	M 	180 	85 	0
Student 10 	A 	B 	F 	166 	54 	2
Student 11 	C 	C 	M 	162 	66 	0
Student 12 	A 	C 	M 	153 	74 	0
Student 13 	A 	B 	M 	160 	62 	2
Student 14 	B 	C 	F 	169 	59 	2
Student 15 	A 	B 	F 	171 	71 	1
In the above code,
- First, I read the dataset from a CSV file using the
read_csv()method. Theread_csv()method takes the filename of the CSV file as its input argument and returns a pandas dataframe containing the dataset. - After that, I dropped the unwanted column (
Student) from the input dataset using thedrop()method. Thedrop()method takes a list of column names that need to be dropped. After execution, we get the modified dataframe. - In the third step, I normalized the values in the numeric attributes. This is important to make sure that the difference in the numeric values does not outweigh the difference in categorical values. You can read about this explicitly in the article on clustering mixed data types in Python.
- After normalization, I extracted a numpy array of the values in the dataframe using the values attribute of the dataframe.
- Once we got the values in the array, I specified the data type of each column using the
astype()method. Theastype()method, when invoked on a list or array of elements, takes the name of the required data type and converts all the elements of the array to the given data type. This step is important to ensure that the categorical variables are represented as strings and the numerical values are represented as floating-point numbers or integers. - Next, I used the
KPrototypes()function to create an untrained machine-learning model for k-prototypes clustering. For this example, I have kept the number of clusters as 3 and the maximum number of iterations as 20. - After creating the untrained model, I invoked the
fit_predict()method on the untrained model. Thefit_predict()method takes the input data array as its first input argument. Additionally, it takes the index of the columns having categorical attributes in the“categorical”parameter. After execution, thefit_predict()method returns an array containing the cluster label for each data point in the input dataset. - Finally, I have added the output array to the dataframe containing the input dataset to show the cluster label for each data point.
Now that we have discussed how to perform k-prototypes clustering, let us now discuss how we can find the optimal number of clusters i.e. the best k in k-prototypes clustering.
Finding Best K in K-Prototypes Clustering Using the Elbow Method
With an increase in the number of clusters, the total cluster variance of the clusters decreases rapidly. You can get the cluster variance of a trained k-prototypes clustering model using the cost_ attribute.
After decreasing rapidly, the cluster variance almost becomes constant. Due to this, when we plot the number of clusters and respective cluster variance for each k in k-prototypes clustering, we get an elbow-shaped line. In the chart, the k at which the cluster variance becomes almost constant is selected as the best k for clustering.
To find the best k in k-prototypes clustering using the elbow method, we will use the following steps.
- First, we will create a dictionary say
elbow_scoresto store the total cluster variance for each value of k. - Now, we will use a for loop to find the total cluster variance for each k. In the for loop, we will vary the value of k from 2 to the total number of points in the dataset. You can also choose to vary it from 2 to half of the total number of points in the dataset.
- Inside the for loop, we will perform the following operations.
- We will create an untrained machine-learning model for k-prototypes clustering using the
KPrototypes()function and the current value of k. - Then, we will train the machine learning model using the given dataset and the
fit()method. - After training the model, we will find the total cluster variance for the current k. For this, we can use the
cost_attribute of the model. - After obtaining the total cluster variance, we will store the current value of k as the key and the total cluster variance as the associated value in the
elbow_scoresdictionary.
- We will create an untrained machine-learning model for k-prototypes clustering using the
- After execution of the for loop, we will get the total cluster variance for each k in the
elbow_scoresdictionary. - We will plot the total cluster variance vs k. Then, you can identify the k in the plot after which the total cluster variance becomes almost constant. This k will be the best k optimal number of clusters for our dataset.
Following is the implementation of the program to find the best k using the elbow method for k-prototypes clustering in Python.
#import modules
import pandas as pd
import numpy as np
from kmodes import kprototypes
import matplotlib.pyplot as plt
#read data input
input_data=pd.read_csv("Kprototypes_dataset.csv")
df=input_data.copy()
#drop unnecessary columns
df.drop(columns=["Student"],inplace=True)
#Normalize dataset
df["Height(in cms)"]=(df["Height(in cms)"]/df["Height(in cms)"].abs().max())*5
df["Weight(in Kgs)"]=(df["Weight(in Kgs)"]/df["Weight(in Kgs)"].abs().max())*5
#obtain array of values
data_array=df.values
#specify data types
data_array[:, 0:3] = data_array[:, 0:3].astype(str)
data_array[:, 3:] = data_array[:, 3::].astype(float)
elbow_scores = dict()
range_of_k = range(2,10)
for k in range_of_k :
    untrained_model = kprototypes.KPrototypes(n_clusters=3,max_iter=20)
    trained_model = untrained_model.fit(data_array, categorical=[0, 1, 2])
    elbow_scores[k]=trained_model.cost_

plt.plot(elbow_scores.keys(),elbow_scores.values())
plt.scatter(elbow_scores.keys(),elbow_scores.values())
plt.xlabel("Values of K")
plt.ylabel("Cost")
plt.show()
Output:
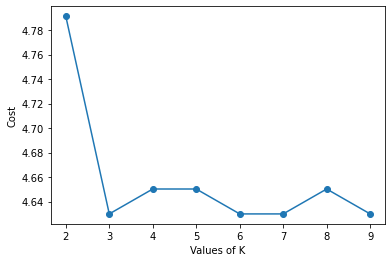
In the output chart, you can observe that there is a sharp decrease in cost from k=2 to k=3. After that, the value of k is almost constant. We can consider k=3 as the elbow point. Hence, we will select 3 as the best k for k-prototypes clustering for the given dataset.
Conclusion
In this article, we have discussed how to find the best k k-prototypes clustering using the elbow method. The k-prototypes cluster algorithm finds its applications in various real-life situations due to its ability to handle mixed data types. You can use k-prototypes clustering in loan classification, customer segmentation, cyber profiling, and other situations where we need to group data into various clusters.
To learn more about machine learning, you can read this article on regression in machine learning. You might also like this article on polynomial regression using sklearn in python.
To read about other computer science topics, you can read this article on dynamic role-based authorization using ASP.net. You can also read this article on user activity logging using Asp.net.
Stay tuned for more informative articles.
Happy Learning!