K-means Clustering Algorithm With Numerical Example
K-means clustering is one of the most used clustering algorithms in machine learning. In this article, we will discuss the concept, examples, advantages, and disadvantages of the k-means clustering algorithm. We will also discuss a numerical on k-means clustering to understand the algorithm in a better way.
What is K-means Clustering?
K-means clustering is an unsupervised machine learning algorithm used to group a dataset into k clusters. It is an iterative algorithm that starts by randomly selecting k centroids in the dataset. After selecting the centroids, the entire dataset is divided into clusters based on the distance of the data points from the centroid. In the new clusters, the centroids are calculated by taking the mean of the data points.
With the new centroids, we regroup the dataset into new clusters. This process continues until we get a stable cluster.K-means clustering is a partition clustering algorithm. We call it partition clustering because of the reason that the k-means clustering algorithm partitions the entire dataset into mutually exclusive clusters.
K-means Clustering Algorithm
To understand the process of clustering using the k-means clustering algorithm and solve the numerical example, let us first state the algorithm. Given a dataset of N entries and a number K as the number of clusters that need to be formed, we will use the following steps to find the clusters using the k-means algorithm.
- First, we will select K random entries from the dataset and use them as centroids.
- Now, we will find the distance of each entry in the dataset from the centroids. You can use any distance metric such as euclidean distance, Manhattan distance, or squared euclidean distance.
- After finding the distance of each data entry from the centroids, we will start assigning the data points to clusters.We will assign each data point to the cluster with the centroid to which it has the least distance.
- After assigning the points to clusters, we will calculate the new centroid of the clusters. For this, we will use the mean of each data point in the same cluster as the new centroid. If the newly created centroids are the same as the centroids in the previous iteration, we will consider the current clusters to be final. Hence, we will stop the execution of the algorithm. If any of the newly created centroids is different from the centroids in the previous iteration, we will go to step 2.
K-means Clustering Numerical Example with Solution
Now that we have discussed the algorithm, let us solve a numerical problem on k means clustering. The problem is as follows.You are given 15 points in the Cartesian coordinate system as follows.
| Point | Coordinates |
| A1 | (2,10) |
| A2 | (2,6) |
| A3 | (11,11) |
| A4 | (6,9) |
| A5 | (6,4) |
| A6 | (1,2) |
| A7 | (5,10) |
| A8 | (4,9) |
| A9 | (10,12) |
| A10 | (7,5) |
| A11 | (9,11) |
| A12 | (4,6) |
| A13 | (3,10) |
| A14 | (3,8) |
| A15 | (6,11) |
We are also given the information that we need to make 3 clusters. It means we are given K=3.We will solve this numerical on k-means clustering using the approach discussed below.
First, we will randomly choose 3 centroids from the given data. Let us consider A2 (2,6), A7 (5,10), and A15 (6,11) as the centroids of the initial clusters. Hence, we will consider that
- Centroid 1=(2,6) is associated with cluster 1.
- Centroid 2=(5,10) is associated with cluster 2.
- Centroid 3=(6,11) is associated with cluster 3.
Now we will find the euclidean distance between each point and the centroids. Based on the minimum distance of each point from the centroids, we will assign the points to a cluster. I have tabulated the distance of the given points from the clusters in the following table
| Point | Distance from Centroid 1 (2,6) | Distance from Centroid 2 (5,10) | Distance from Centroid 3 (6,11) | Assigned Cluster |
| A1 (2,10) | 4 | 3 | 4.123106 | Cluster 2 |
| A2 (2,6) | 0 | 5 | 6.403124 | Cluster 1 |
| A3 (11,11) | 10.29563 | 6.082763 | 5 | Cluster 3 |
| A4 (6,9) | 5 | 1.414214 | 2 | Cluster 2 |
| A5 (6,4) | 4.472136 | 6.082763 | 7 | Cluster 1 |
| A6 (1,2) | 4.123106 | 8.944272 | 10.29563 | Cluster 1 |
| A7 (5,10) | 5 | 0 | 1.414214 | Cluster 2 |
| A8 (4,9) | 3.605551 | 1.414214 | 2.828427 | Cluster 2 |
| A9 (10,12) | 10 | 5.385165 | 4.123106 | Cluster 3 |
| A10 (7,5) | 5.09902 | 5.385165 | 6.082763 | Cluster 1 |
| A11 (9,11) | 8.602325 | 4.123106 | 3 | Cluster 3 |
| A12 (4,6) | 2 | 4.123106 | 5.385165 | Cluster 1 |
| A13 (3,10) | 4.123106 | 2 | 3.162278 | Cluster 2 |
| A14 (3,8) | 2.236068 | 2.828427 | 4.242641 | Cluster 1 |
| A15 (6,11) | 6.403124 | 1.414214 | 0 | Cluster 3 |
At this point, we have completed the first iteration of the k-means clustering algorithm and assigned each point into a cluster.
In the above table, you can observe that the point that is closest to the centroid of a given cluster is assigned to the cluster.
Now, we will calculate the new centroid for each cluster.
- In cluster 1, we have 6 points i.e. A2 (2,6), A5 (6,4), A6 (1,2), A10 (7,5), A12 (4,6), A14 (3,8). To calculate the new centroid for cluster 1, we will find the mean of the x and y coordinates of each point in the cluster. Hence, the new centroid for cluster 1 is (3.833, 5.167).
- In cluster 2, we have 5 points i.e. A1 (2,10), A4 (6,9), A7 (5,10) , A8 (4,9), and A13 (3,10). Hence, the new centroid for cluster 2 is (4, 9.6)
- In cluster 3, we have 4 points i.e. A3 (11,11), A9 (10,12), A11 (9,11), and A15 (6,11). Hence, the new centroid for cluster 3 is (9, 11.25).
Now that we have calculated new centroids for each cluster, we will calculate the distance of each data point from the new centroids. Then, we will assign the points to clusters based on their distance from the centroids. The results for this process have been given in the following table.
| Point | Distance from Centroid 1 (3.833, 5.167) | Distance from centroid 2 (4, 9.6) | Distance from centroid 3 (9, 11.25) | Assigned Cluster |
| A1 (2,10) | 5.169 | 2.040 | 7.111 | Cluster 2 |
| A2 (2,6) | 2.013 | 4.118 | 8.750 | Cluster 1 |
| A3 (11,11) | 9.241 | 7.139 | 2.016 | Cluster 3 |
| A4 (6,9) | 4.403 | 2.088 | 3.750 | Cluster 2 |
| A5 (6,4) | 2.461 | 5.946 | 7.846 | Cluster 1 |
| A6 (1,2) | 4.249 | 8.171 | 12.230 | Cluster 1 |
| A7 (5,10) | 4.972 | 1.077 | 4.191 | Cluster 2 |
| A8 (4,9) | 3.837 | 0.600 | 5.483 | Cluster 2 |
| A9 (10,12) | 9.204 | 6.462 | 1.250 | Cluster 3 |
| A10 (7,5) | 3.171 | 5.492 | 6.562 | Cluster 1 |
| A11 (9,11) | 7.792 | 5.192 | 0.250 | Cluster 3 |
| A12 (4,6) | 0.850 | 3.600 | 7.250 | Cluster 1 |
| A13 (3,10) | 4.904 | 1.077 | 6.129 | Cluster 2 |
| A14 (3,8) | 2.953 | 1.887 | 6.824 | Cluster 2 |
| A15 (6,11) | 6.223 | 2.441 | 3.010 | Cluster 2 |
Now, we have completed the second iteration of the k-means clustering algorithm and assigned each point into an updated cluster. In the above table, you can observe that the point closest to the new centroid of a given cluster is assigned to the cluster.
Now, we will calculate the new centroid for each cluster for the third iteration.
- In cluster 1, we have 5 points i.e. A2 (2,6), A5 (6,4), A6 (1,2), A10 (7,5), and A12 (4,6). To calculate the new centroid for cluster 1, we will find the mean of the x and y coordinates of each point in the cluster. Hence, the new centroid for cluster 1 is (4, 4.6).
- In cluster 2, we have 7 points i.e. A1 (2,10), A4 (6,9), A7 (5,10) , A8 (4,9), A13 (3,10), A14 (3,8), and A15 (6,11). Hence, the new centroid for cluster 2 is (4.143, 9.571)
- In cluster 3, we have 3 points i.e. A3 (11,11), A9 (10,12), and A11 (9,11). Hence, the new centroid for cluster 3 is (10, 11.333).
At this point, we have calculated new centroids for each cluster. Now, we will calculate the distance of each data point from the new centroids. Then, we will assign the points to clusters based on their distance from the centroids. The results for this process have been given in the following table.
| Point | Distance from Centroid 1 (4, 4.6) | Distance from centroid 2 (4.143, 9.571) | Distance from centroid 3 (10, 11.333) | Assigned Cluster |
| A1 (2,10) | 5.758 | 2.186 | 8.110 | Cluster 2 |
| A2 (2,6) | 2.441 | 4.165 | 9.615 | Cluster 1 |
| A3 (11,11) | 9.485 | 7.004 | 1.054 | Cluster 3 |
| A4 (6,9) | 4.833 | 1.943 | 4.631 | Cluster 2 |
| A5 (6,4) | 2.088 | 5.872 | 8.353 | Cluster 1 |
| A6 (1,2) | 3.970 | 8.197 | 12.966 | Cluster 1 |
| A7 (5,10) | 5.492 | 0.958 | 5.175 | Cluster 2 |
| A8 (4,9) | 4.400 | 0.589 | 6.438 | Cluster 2 |
| A9 (10,12) | 9.527 | 6.341 | 0.667 | Cluster 3 |
| A10 (7,5) | 3.027 | 5.390 | 7.008 | Cluster 1 |
| A11 (9,11) | 8.122 | 5.063 | 1.054 | Cluster 3 |
| A12 (4,6) | 1.400 | 3.574 | 8.028 | Cluster 1 |
| A13 (3,10) | 5.492 | 1.221 | 7.126 | Cluster 2 |
| A14 (3,8) | 3.544 | 1.943 | 7.753 | Cluster 2 |
| A15 (6,11) | 6.705 | 2.343 | 4.014 | Cluster 2 |
Now, we have completed the third iteration of the k-means clustering algorithm and assigned each point into an updated cluster. In the above table, you can observe that the point that is closest to the new centroid of a given cluster is assigned to the cluster.
Now, we will calculate the new centroid for each cluster for the third iteration.
- In cluster 1, we have 5 points i.e. A2 (2,6), A5 (6,4), A6 (1,2), A10 (7,5), and A12 (4,6). To calculate the new centroid for cluster 1, we will find the mean of the x and y coordinates of each point in the cluster. Hence, the new centroid for cluster 1 is (4, 4.6).
- In cluster 2, we have 7 points i.e. A1 (2,10), A4 (6,9), A7 (5,10) , A8 (4,9), A13 (3,10), A14 (3,8), and A15 (6,11). Hence, the new centroid for cluster 2 is (4.143, 9.571)
- In cluster 3, we have 3 points i.e. A3 (11,11), A9 (10,12), and A11 (9,11). Hence, the new centroid for cluster 3 is (10, 11.333).
Here, you can observe that no point has changed its cluster compared to the previous iteration. Due to this, the centroid also remains constant. Therefore, we will say that the clusters have been stabilized. Hence, the clusters obtained after the third iteration are the final clusters made from the given dataset. If we plot the clusters on a graph, the graph looks like as follows.
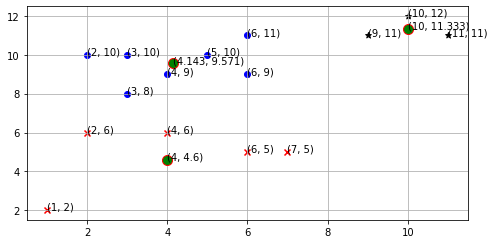
In the above plot, points in the clusters have been plotted using red, blue, and black markers. The centroids of the clusters have been marked using green circles.
Applications of K-means Clustering in Machine Learning
K-means clustering algorithm finds its applications in various domains. Following are some of the popular applications of k-means clustering.
- Document Classification: Using k-means clustering, we can divide documents into various clusters based on their content, topics, and tags.
- Customer segmentation: Supermarkets and e-commerce websites divide their customers into various clusters based on their transaction data and demography. This helps the business to target appropriate customers with relevant products to increase sales.
- Cyber profiling: In cyber profiling, we collect data from individuals as well as groups to identify their relationships. With k-means clustering, we can easily make clusters of people based on their connection to each other to identify any available patterns.
- Image segmentation: We can use k-means clustering to perform image segmentation by grouping similar pixels into clusters.
- Fraud detection in banking and insurance: By using historical data on frauds, banks and insurance agencies can predict potential frauds by the application of k-means clustering.
Apart from these examples, there are various other applications of k-means clustering such as ride-share data analysis, social media profiling, identification of crime localities, etc.
Suggested Reading: Advanced Coding Concepts
Advantages of K-means Clustering Algorithm
Following are some of the advantages of the k-means clustering algorithm.
- Easy to implement: K-means clustering is an iterable algorithm and a relatively simple algorithm. In fact, we can also perform k-means clustering manually as we did in the numerical example.
- Scalability: We can use k-means clustering for even 10 records or even 10 million records in a dataset. It will give us results in both cases.
- Convergence: The k-means clustering algorithm is guaranteed to give us results. It guarantees convergence. Thus, we will get the result of the execution of the algorithm for sure.
- Generalization: K-means clustering doesn’t apply to a specific problem. From numerical data to text documents, you can use the k-means clustering algorithm on any dataset to perform clustering. It can also be applied to datasets of different sizes having entirely different distributions in the dataset. Hence, this algorithm is completely generalized.
- Choice of centroids: You can warm-start the choice of centroids in an easy manner. Hence, the algorithm allows you to choose and assign centroids that fit well with the dataset.
Disadvantages of K-means Clustering Algorithm
With all the advantages, the k-means algorithm has certain disadvantages too which are discussed below.
- Deciding the number of clusters: In k-means clustering, you need to decide the number of clusters by using the elbow method.
- Choice of initial centroids: The number of iterations in the clustering process completely depends on the choice of centroids. Hence, you need to properly choose the centroids in the initial step for maximizing the efficiency of the algorithm.
- Effect of outliers: In the execution of the k-means clustering algorithm, we use all the points in a cluster to determine the centroids for the next iteration. If there are outliers in the dataset, they highly affect the position of the centroids. Due to this, the clustering becomes inaccurate. To avoid this, you can try to identify outliers and remove them in the data cleaning process.
- Curse of Dimensionality: If the number of dimensions in the dataset increases, the distance of the data points from a given point starts converging to a specific value. Due to this, k-means clustering that calculates the clusters based on the distance between the points becomes inefficient. To overcome this problem, you can use advanced clustering algorithms like spectral clustering. Alternatively, you can also try to reduce the dimensionality of the dataset while data preprocessing.
Conclusion
In this article, we have explained the k-means clustering algorithm with a numerical example. We have also discussed the applications, advantages, and disadvantages of the k-means clustering algorithm.
To learn more about machine learning, you can read this article on regression in machine learning. You might also like this article on polynomial regression using sklearn in python.
To read about other computer science topics, you can read this article on dynamic role-based authorization using ASP.net. You can also read this article on user activity logging using Asp.net.