K-Means Clustering Using sklearn in Python
K-means clustering is one of the most used unsupervised machine learning techniques. In this article, we will first discuss the basics of the K-means clustering algorithm. After that, we will implement k-means clustering using the sklearn module in Python. We will also use the Elbow method and the Silhouette coefficient method to find the optimal number of clusters for a given dataset.
What is K-Means Clustering?
K-means clustering is an unsupervised machine learning algorithm used to group a dataset into k clusters. It is an iterative algorithm that begins by picking k centroids at random from the dataset. The entire dataset is then separated into clusters according to how far the data points are from the centroid once the centroids have been chosen. The centroids in the new clusters are determined by averaging the data points.
We reorganize the dataset into new clusters using the new centroids. We keep going through this process until we have a stable cluster. K-means clustering is a partition clustering algorithm. We call it partition clustering because of the reason that the k-means clustering algorithm partitions the entire dataset into mutually exclusive clusters.
We have discussed the k-means clustering algorithm with a numerical example in another article. I would highly recommend you to read this article on the k-means clustering algorithm with a numerical example before going through the implementation of the algorithm. Reading the algorithm and understanding the numerical example will help you understand what really happens during the clustering process in k-means clustering.
K-Means clustering Using Sklearn Module in Python
I hope that you have read the suggested article and understood the numerical example. Let us now discuss the implementation of the k-means clustering algorithm using the sklearn module in Python.
To implement the k-means clustering algorithm using the sklearn module in Python, we will use the dataset that we used in the numerical example. Following are the data points in the dataset.
Data = [(2,10), (2,6), (11,11), (6,9), (6,4), (1,2), (5,10), (4,9), (10,12), (7,5), (9,11), (4,6), (3,10),(3,8), (6,11)]The KMeans() Function
To perform k-means clustering, we will use the KMeans() function defined in the sklearn.cluster module.
The KMeans() function has the following syntax:
KMeans( n_clusters, init, n_init, max_iter, tol=1e-04, random_state=0) Here,
- The
n_clustersparameter takes the number of clusters as its input argument. As we want to create 3 clusters in the data, we will pass 3 to then_clustersparameter. - The
initparameter accepts the mode of initialization. It is used to choose the initial centroids for the clusters. We will randomly select the centroids. Hence, we will pass the value ‘random’ to theinitparameter. However, its default value is‘k-means++’ which selects initial cluster centroids using sampling based on an empirical probability distribution of the points’ contribution to the overall inertia. - The
n_initparameter takes the number of times the k-means algorithm will run with different centroid seeds. The final result depends on the best output ofn_initconsecutive runs in terms of inertia. Its default value is 10. - The
max_iterparameter takes the maximum number of iterations of the k-means algorithm for a single run. Its default value is 300. - The ‘
tol’ parameter determines relative tolerance with regards to the Frobenius norm of the difference in the cluster centers of two consecutive iterations to declare convergence. Its default value is 1e-04. - The
random_stateparameter determines random number generation for centroid initialization. Its default value is None. To make the random number generation deterministic, you can pass an integer value as an input argument to this parameter.
After execution, the KMeans() function returns an untrained machine learning model for k-means clustering.
Implementation of K-Means clustering Using Sklearn in Python
To implement k-means clustering sklearn in Python, we use the following steps.
- We will first create an untrained clustering model using the
KMeans()function. - After obtaining the untrained model, we will use the
fit()function to train the machine learning model. Thefit()function, when invoked on the model returned by theKMeans()function, takes the list containing the dataset as its input and returns a trained machine learning model. - After obtaining the trained model, we will use the
predict()function to determine the cluster assigned to each point in the dataset. Thepredict()method, when invoked on a trained machine learning model, takes a list of data points as its input argument. After execution, it returns a list having a cluster label for each data point given in the input argument. - After obtaining the cluster labels for data points, we will make a separate list of data points in each cluster using list comprehension.
- Then, we will plot the clusters using the matplotlib module functions.
The entire implementation of the K-means clustering algorithm has been given below.
data=[(2,10),(2,6),(11,11),(6,9),(6,4),(1,2),(5,10),(4,9),(10,12),(7,5),(9,11),(4,6),(3,10),(3,8),(6,11)]
from sklearn.cluster import KMeans

untrained_model = KMeans(
    n_clusters=3, init='random',
    n_init=10, max_iter=300,
    tol=1e-04, random_state=0
)
trained_model = untrained_model.fit(data)
labels_for_input_data=trained_model.predict(data)
print("The labels for input data are:")
print(labels_for_input_data)
#segregating indices of each cluster
indices=range(0,15)
cluster0=[index for index in indices if labels_for_input_data[index]==0]
cluster1=[index for index in indices if labels_for_input_data[index]==1]
cluster2=[index for index in indices if labels_for_input_data[index]==2]
#segregating points from each cluster
points_in_cluster0=[data[index] for index in cluster0]
points_in_cluster1=[data[index] for index in cluster1]
points_in_cluster2=[data[index] for index in cluster2]
print("The points in cluster 1 are:", points_in_cluster0)
print("The points in cluster 2 are:", points_in_cluster1)
print("The points in cluster 3 are:", points_in_cluster2)
Output:
The labels for input data are:
[1 0 2 1 0 0 1 1 2 0 2 0 1 1 1]
The points in cluster 1 are: [(2, 6), (6, 4), (1, 2), (7, 5), (4, 6)]
The points in cluster 2 are: [(2, 10), (6, 9), (5, 10), (4, 9), (3, 10), (3, 8), (6, 11)]
The points in cluster 3 are: [(11, 11), (10, 12), (9, 11)]
In the above output, the list containing labels denotes the cluster of the point at each index in the input dataset. Then, we have performed list comprehension to find the points in each clusters and printed them.
The plot for the clusters is as follows.
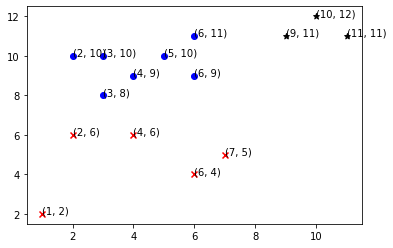
In the above output, you can observe that the clusters formed are similar to the clusters obtained in the numerical example.
You can also assign clusters to new data points using the trained model and the predict() method. For this, you just have to pass a list of data points as input argument to the predict() method. After execution, it will return a list containing labels for each data point in the input. You can observe this in the following example.
training_data=[(2,10),(2,6),(11,11),(6,9),(6,4),(1,2),(5,10),(4,9),(10,12),(7,5),(9,11),(4,6),(3,10),(3,8),(6,11)]
input_data=[(3,4),(4,5)]
from sklearn.cluster import KMeans

untrained_model = KMeans(
    n_clusters=3, init='random',
    n_init=10, max_iter=300,
    tol=1e-04, random_state=0
)
trained_model = untrained_model.fit(training_data)
labels_for_input_data=trained_model.predict(input_data)
print("The input data for prediction is:",input_data)
print("The labels for input data are:",labels_for_input_data)
Output:
The input data for prediction is: [(3, 4), (4, 5)]
The labels for input data are: [0 0]
In the output, both the inputs i.e. (3, 4) and (4, 5) have been assigned the label 0. Hence, they belong to cluster 1.
In the above example, we have randomly selected the number of clusters to be 3. In real-life situations, this approach won’t work. We first need to find the optimal number of clusters in the dataset.
To find the optimal number of clusters in k-means clustering, we can use the Elbow method or the Silhouette coefficient approach. Let us discuss them one by one.
Using the Elbow Method to Find the Optimal Number of Clusters in K-Means Clustering
In the elbow method, we train the machine learning model by giving different values of k to the KMeans() function. After training the model, we find the sum of squared distances of each point from the centroids.
We start with a single cluster and calculate the sum of squared distances. As we increase the number of clusters, the sum of squared distances decreases rapidly. However, after a certain number, the sum of squared distances becomes almost constant. This point denotes the optimal number of clusters. The graph of this entire process looks like a bent arm where the point denoting the optimal number of clusters looks like the elbow of the hand. Hence, the approach is termed the Elbow method.
To implement the elbow method for k-means clustering using the sklearn module in Python, we will use the following steps.
- First, we will create a dictionary say
elbow_scoresto store the sum of squared distances for each value of k. - Now, we will use a for loop to find the sum of squared distances for each k. In the for loop, we will vary the value of k from 2 to the total number of points in the dataset. You can also choose to vary it from 2 to half of the total number of points in the dataset.
- Inside the for loop, we will perform the following operations.
- We will create an untrained machine learning model for k-means clustering using the
KMeans()function and the current value of k. - Then, we will train the machine learning model using the given dataset and the
fit()method. - After training the model, we will find the sum of squared distances. For this, we can use the
inertia_attribute of the model. - After obtaining the sum of squared distances, we will store the current value of k as the key and the sum of squared distances as the associated value in the
elbow_scoresdictionary. - After execution of the for loop, we will get the sum of squared distances for each k in the
elbow_scoresdictionary. - We will plot the sum of squared distances vs k. Then, you can identify the k in the plot after which the sum of squared distances becomes almost constant. This k will be the optimal number of clusters for our dataset.
Following is the implementation of the elbow method for k-means clustering using the sklearn module in Python.
import matplotlib.pyplot as plt
training_data=[(2,10),(2,6),(11,11),(6,9),(6,4),(1,2),(5,10),(4,9),(10,12),(7,5),(9,11),(4,6),(3,10),(3,8),(6,11)]
elbow_scores = dict()
range_of_k = range(2,10)
for k in range_of_k :
 untrained_model = KMeans(n_clusters=k)
 trained_model=untrained_model.fit(training_data)
 elbow_scores[k]=trained_model.inertia_

plt.plot(elbow_scores.keys(),elbow_scores.values())
plt.scatter(elbow_scores.keys(),elbow_scores.values())
plt.xlabel("Values of K")
plt.ylabel("Sum of squared distances")
plt.show()
Output:
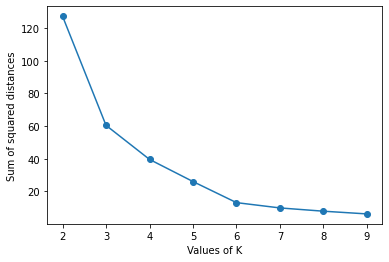
In the above plot, k=3 or k=4 can be the optimal number of clusters in the dataset. This is a drawback of the elbow method that we are not able to identify exactly what should be the optimal number of clusters. This is due to the reason that we try to observe it visually and the slope of the plot cannot always have a drastic change. The approach using Silhouette coefficient to find the optimal number of clusters in the dataset doesn’t have any such drawback.
Instead of the elbow method, you can use the Silhouette coefficient to find the optimal number of clusters as discussed below.
Using the Silhouette Coefficient to Find the Suitable Number of Clusters in K-Means Clustering
The silhouette coefficient helps us measure the cohesion in the clusters. It is the measure of how similar a data point is from the points in its own cluster and how similar it is to data points in other clusters.
We use the following steps to calculate the Silhouette coefficient for a data point.
- First, we calculate the average distance between data points in the current cluster and with other points in the same cluster. Let us denote the value by a.
- Then, we calculate the average distance between the data point in the current cluster and data points in the nearest cluster other than the current cluster. Let us denote this value by b.
- Now, we find the maximum of the average distance between data points in the current cluster and with other points in the same cluster i.e. the value a, and the average distance between the data point in the current cluster and data points in the nearest cluster other than the current cluster. i.e. the value b.
- The Silhouette coefficient for the current cluster is given by (b-a) divided by
max(b, a). - After finding the Silhouette coefficient for each cluster in the dataset, we calculate the average Silhouette coefficient by taking the mean of the Silhouette coefficient of each cluster in the dataset.
- The number of clusters for which the Silhouette coefficient has maximum value is considered the optimal number of clusters.
To implement the program to calculate the Silhouette coefficient for k-means clustering using the sklearn module in Python, we will use the following steps.
- First, we will create a dictionary say
silhouette_scoresto store the average Silhouette coefficient for each value of k in the k-means clustering. - Now, we will use a for loop to find the Silhouette coefficient for each k. In the for loop, we will vary the value of k from 2 to the total number of points in the dataset. You can also choose to vary it from 2 to the possible maximum number of clusters in the dataset.
- Inside the for loop, we will perform the following operations.
- We will create an untrained machine learning model for k-means clustering using the
KMeans()function and the current value of k. - Then, we will train the machine learning model using the given dataset and the
fit()method. - After training the model, we will obtain the labels in the dataset using the
labels_attribute of the machine learning model. - Now we will use the
silhouette_score()function defined in thesklearn.metricsmodule to calculate the average silhouette score for each k. Thesilhouette_score()function takes the dataset as its first input argument and cluster labels as its second input argument. After execution, it returns the silhouette score for the given k. - After obtaining the silhouette score, we will store the current value of k as the key and the silhouette score as the associated value in the
silhouette_scoresdictionary.
- We will create an untrained machine learning model for k-means clustering using the
After execution of the for loop, we will get the silhouette score for each k in the silhouette_scores dictionary.
The value of k for which the silhouette score is maximum will be considered as the suitable number of clusters in the k-means clustering algorithm.
Following is the program to find the silhouette scores for each k in the k-means clustering algorithm using the sklearn module in Python.
import matplotlib.pyplot as plt
from sklearn.metrics import silhouette_score
training_data=[(2,10),(2,6),(11,11),(6,9),(6,4),(1,2),(5,10),(4,9),(10,12),(7,5),(9,11),(4,6),(3,10),(3,8),(6,11)]
silhouette_scores = dict()
range_of_k = range(2,10)
for k in range_of_k :
    untrained_model = KMeans(n_clusters=k)
    trained_model=untrained_model.fit(training_data)
    cluster_labels = trained_model.labels_
    score=silhouette_score(training_data, cluster_labels)
    silhouette_scores[k]=score
print("The k and associated Silhouette scores are: ",silhouette_scores)
Output:
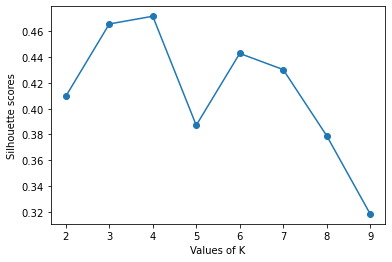
The k and associated Silhouette scores are: {2: 0.40955609233587087, 3: 0.4656478498683258, 4: 0.4716346171963804, 5: 0.3871275219002748, 6: 0.4428140295927011, 7: 0.4302882476308248, 8: 0.3790387001105711, 9: 0.31842263104355273}In the above output, you can observe that the Silhouette coefficient is maximum for k=4. Hence, the optimal number of clusters in the dataset will be 4.
You can also observe that the Silhouette coefficient for k=3 is very close to Silhouette coefficient for k=4. However, we maximize the Silhouette coefficient. Hence, we will always have a unique value for optimal number of clusters.
You can plot the silhouette scores against the k-values as shown below.
import matplotlib.pyplot as plt
from sklearn.metrics import silhouette_score
training_data=[(2,10),(2,6),(11,11),(6,9),(6,4),(1,2),(5,10),(4,9),(10,12),(7,5),(9,11),(4,6),(3,10),(3,8),(6,11)]
silhouette_scores = dict()
range_of_k = range(2,10)
for k in range_of_k :
    untrained_model = KMeans(n_clusters=k)
    trained_model=untrained_model.fit(training_data)
    cluster_labels = trained_model.labels_
    score=silhouette_score(training_data, cluster_labels)
    silhouette_scores[k]=score
print("The k and associated Silhouette scores are: ",silhouette_scores)
plt.plot(silhouette_scores.keys(),silhouette_scores.values())
plt.scatter(silhouette_scores.keys(),silhouette_scores.values())
plt.xlabel("Values of K")
plt.ylabel("Silhouette scores")
plt.show()
Output:
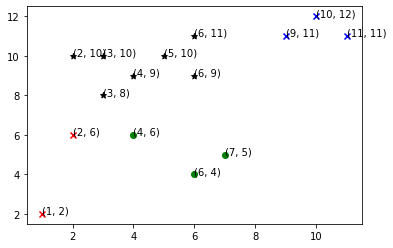
Using the elbow method and silhouette score approach, we have identified that the suitable number of clusters for our dataset is 4. Hence, let us plot the clusters using k=4.
data=[(2,10),(2,6),(11,11),(6,9),(6,4),(1,2),(5,10),(4,9),(10,12),(7,5),(9,11),(4,6),(3,10),(3,8),(6,11)]
from sklearn.cluster import KMeans

untrained_model = KMeans(
    n_clusters=4, init='random',
    n_init=10, max_iter=300,
    tol=1e-04, random_state=0
)
trained_model = untrained_model.fit(data)
labels_for_input_data=trained_model.predict(data)
print("The labels for input data are:")
print(labels_for_input_data)
#segregating indices of each cluster
indices=range(0,15)
cluster0=[index for index in indices if labels_for_input_data[index]==0]
cluster1=[index for index in indices if labels_for_input_data[index]==1]
cluster2=[index for index in indices if labels_for_input_data[index]==2]
cluster3=[index for index in indices if labels_for_input_data[index]==3]

#segregating points from each cluster
points_in_cluster0=[data[index] for index in cluster0]
points_in_cluster1=[data[index] for index in cluster1]
points_in_cluster2=[data[index] for index in cluster2]
points_in_cluster3=[data[index] for index in cluster3]
print("The points in cluster 1 are:", points_in_cluster0)
print("The points in cluster 2 are:", points_in_cluster1)
print("The points in cluster 3 are:", points_in_cluster2)
print("The points in cluster 4 are:", points_in_cluster3)
Output:
The labels for input data are:
[2 0 3 2 1 0 2 2 3 1 3 1 2 2 2]
The points in cluster 1 are: [(2, 6), (1, 2)]
The points in cluster 2 are: [(6, 4), (7, 5), (4, 6)]
The points in cluster 3 are: [(2, 10), (6, 9), (5, 10), (4, 9), (3, 10), (3, 8), (6, 11)]
The points in cluster 4 are: [(11, 11), (10, 12), (9, 11)]
Output:
Precautions while using k-means clustering
- In k-means clustering, you need to know the optimal number of clusters. Therefore, you first need to identify the optimal number of clusters using the elbow method or the silhouette method. I would recommend using the silhouette method as it gives a clear indication of the optimal number of clusters.
- The K-means clustering is non-deterministic. The output clusters are dependent on the choice of initial centroids. Thus, it is possible that you might get different results for the same k in the dataset. It is okay and you don’t need to worry about that.
- K-means clustering is very sensitive to outliers. So, you can try to remove outliers from the dataset during data cleaning. Otherwise, you should first find the optimal number of clusters before using k-means clustering.
- The k-means clustering doesn’t work with categorical data. You need to annotate the entire dataset using numerical values while data preprocessing to apply k-means clustering on such datasets.
- While choosing the maximum number of iterations in the k-means algorithm, you need to take a higher number of iterations. It is possible that the algorithm may not converge to specific clusters for a lower number of iterations. Thus, make sure that you choose a large value as the number of iterations.
Conclusion
In this article, we have discussed the implementation of the k-means clustering algorithm using the sklearn module in Python. We have also discussed the elbow method and the silhouette method to find the optimal number of clusters in the k-means algorithm.
To learn more about machine learning, you can read this article on regression in machine learning. You might also like this article on polynomial regression using sklearn in python.
To read about other computer science topics, you can read this article on dynamic role-based authorization using ASP.net. You can also read this article on user activity logging using Asp.net.