Creating Interactive Dashboards in Asp.net Core MVC
Dashboards used to represent Application’s Data. Actually one of the main purposes of a Dashboard is to give an overview of the complete application. In Applications like Admin Panel, Dashboards should be Powerfull enough to give a complete summary of your Apps running in a real-time environment.
Here’s my Tutorial, If you’re interested in Dynamic User-defined Dashboards using Asp.Net Core
This is the 7th Part of Admin Panel Tutorial Series.
- Choosing Template for Admin Panel
- Creating a Database
- Setup AdminLTE Template in Asp.net Core MVC project
- Creating Models
- Login Page for Admin Panel
- CRUD(Create, Read, Update, Delete) Operations
- Creating Interactive Dashboards
- Audit Trail / Activity Logging
- Role-Based Authorization
- Error Logging
Creating Dashboards breaks down into two portions:
- Dashboard Design
- Populating it with required data.
For the first portion, you’ll have to do CSS and HTML work. And for it, you can search for already created HTML templates.
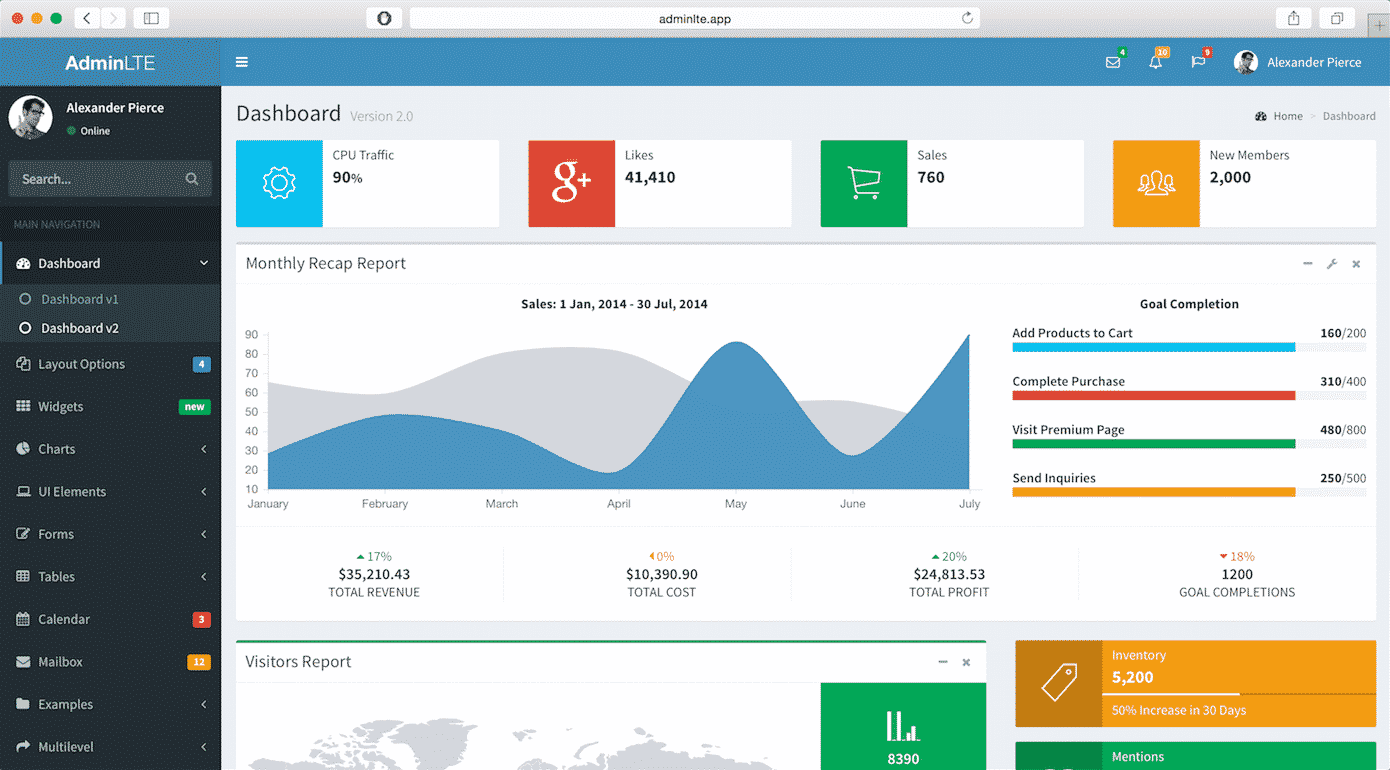
Chats, Graphs, Tables & Tiles make the Dashboards more Interactive & help to better understand your business. So, Let’s start from here.
I’ll recommend you to always use a Template to create Dashboards because in a Template you’ll get everything already included for you. You’ll just need to download, Setup & start development.
I’ll use AdminLTE for Designing our Dashboards. If you don’t know how to setup AdminLTE Template with Asp.net Core MVC Project,
here’s the simple setup Tutorial for you => Setting up Admin Template in Asp.net Core MVC
I hope that following above article you have setup Template with your Asp.net Core project.
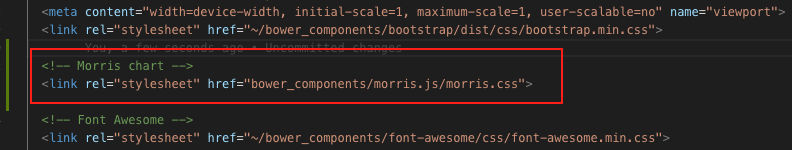
Add this Line at the start of your “_Layout.cshtml” page right after BootStrap css
<!-- Morris chart -->
<link rel="stylesheet" href="bower_components/morris.js/morris.css">
Like this
Now Open your “Index.cshtml” inside your Views -> Home Folder & paste this code:
@model AdminPanelTutorial.Models.DashboardViewModel

<section class="content-header">
    <h1>
    Dashboard
    <small>Control panel</small>
    </h1>
    <ol class="breadcrumb">
    <li><a href="#"><i class="fa fa-dashboard"></i> Home</a></li>
    <li class="active">Dashboard</li>
    </ol>
</section>
<!-- Main content -->
<section class="content">
    <!-- Small boxes (Stat box) -->
    <div class="row">
    <div class="col-lg-3 col-xs-6">
        <!-- small box -->
        <div class="small-box bg-aqua">
        <div class="inner">
            <h3>@Model.doctors_count</h3>
            <p>Doctors</p>
        </div>
        <div class="icon">
            <i class="fa fa-users"></i>
        </div>
        <a href="#" class="small-box-footer">More info <i class="fa fa-arrow-circle-right"></i></a>
        </div>
    </div>
    <!-- ./col -->
    <div class="col-lg-3 col-xs-6">
        <!-- small box -->
        <div class="small-box bg-green">
        <div class="inner">
            <h3>@Model.nurses_count<sup style="font-size: 20px"></sup></h3>
            <p>Nurses</p>
        </div>
        <div class="icon">
            <i class="fa fa-users"></i>
        </div>
        <a href="#" class="small-box-footer">More info <i class="fa fa-arrow-circle-right"></i></a>
        </div>
    </div>
    <!-- ./col -->
    <div class="col-lg-3 col-xs-6">
        <!-- small box -->
        <div class="small-box bg-yellow">
        <div class="inner">
            <h3>@Model.patients_count</h3>
            <p>Patients</p>
        </div>
        <div class="icon">
            <i class="ion ion-person"></i>
        </div>
        <a href="#" class="small-box-footer">More info <i class="fa fa-arrow-circle-right"></i></a>
        </div>
    </div>
    <!-- ./col -->
    <div class="col-lg-3 col-xs-6">
        <!-- small box -->
        <div class="small-box bg-red">
        <div class="inner">
            <h3>65</h3>
            <p>This Month</p>
        </div>
        <div class="icon">
            <i class="ion ion-pie-graph"></i>
        </div>
        <a href="#" class="small-box-footer">More info <i class="fa fa-arrow-circle-right"></i></a>
        </div>
    </div>
    <!-- ./col -->
    </div>
    <!-- /.row -->
    <!-- Main row -->
    <div class="row">
    <!-- Left col -->
    <section class="col-lg-7 connectedSortable">
        <!-- Custom tabs (Charts with tabs)-->
        <!-- DONUT CHART -->
        <div class="box box-danger">
            <div class="box-header with-border">
            <h3 class="box-title">Donut Chart</h3>
            <div class="box-tools pull-right">
                <button type="button" class="btn btn-box-tool" data-widget="collapse"><i class="fa fa-minus"></i>
                </button>
                <button type="button" class="btn btn-box-tool" data-widget="remove"><i class="fa fa-times"></i></button>
            </div>
            </div>
            <div class="box-body chart-responsive">
            <div class="chart" id="sales-chart" style="height: 300px; position: relative;"></div>
            </div>
            <!-- /.box-body -->
        </div>
        <!-- /.nav-tabs-custom -->
    </section>
    <!-- /.Left col -->
    <!-- right col (We are only adding the ID to make the widgets sortable)-->
    <section class="col-lg-5 connectedSortable">
        <!-- TO DO List -->
        <div class="box box-primary">
        <div class="box-header">
            <i class="ion ion-clipboard"></i>
            <h3 class="box-title">To Do List</h3>
            <div class="box-tools pull-right">
            <ul class="pagination pagination-sm inline">
                <li><a href="#">«</a></li>
                <li><a href="#">1</a></li>
                <li><a href="#">2</a></li>
                <li><a href="#">3</a></li>
                <li><a href="#">»</a></li>
            </ul>
            </div>
        </div>
        <!-- /.box-header -->
        <div class="box-body">
            <!-- See dist/js/pages/dashboard.js to activate the todoList plugin -->
            <ul class="todo-list">
            <li>
                <!-- drag handle -->
                <span class="handle">
                    <i class="fa fa-ellipsis-v"></i>
                    <i class="fa fa-ellipsis-v"></i>
                    </span>
                <!-- checkbox -->
                <input type="checkbox" value="">
                <!-- todo text -->
                <span class="text">Patient 1 Check up Time</span>
                <!-- Emphasis label -->
                <small class="label label-danger"><i class="fa fa-clock-o"></i> 2 mins</small>
                <!-- General tools such as edit or delete-->
                <div class="tools">
                <i class="fa fa-edit"></i>
                <i class="fa fa-trash-o"></i>
                </div>
            </li>
            <li>
                    <span class="handle">
                    <i class="fa fa-ellipsis-v"></i>
                    <i class="fa fa-ellipsis-v"></i>
                    </span>
                <input type="checkbox" value="">
                <span class="text">Medicine for X Patient</span>
                <small class="label label-info"><i class="fa fa-clock-o"></i> 4 hours</small>
                <div class="tools">
                <i class="fa fa-edit"></i>
                <i class="fa fa-trash-o"></i>
                </div>
            </li>
            <li>
                    <span class="handle">
                    <i class="fa fa-ellipsis-v"></i>
                    <i class="fa fa-ellipsis-v"></i>
                    </span>
                <input type="checkbox" value="">
                <span class="text">New Patient Operation</span>
                <small class="label label-warning"><i class="fa fa-clock-o"></i> 1 day</small>
                <div class="tools">
                <i class="fa fa-edit"></i>
                <i class="fa fa-trash-o"></i>
                </div>
            </li>
            <li>
                    <span class="handle">
                    <i class="fa fa-ellipsis-v"></i>
                    <i class="fa fa-ellipsis-v"></i>
                    </span>
                <input type="checkbox" value="">
                <span class="text">Ward Visit</span>
                <small class="label label-success"><i class="fa fa-clock-o"></i> 3 days</small>
                <div class="tools">
                <i class="fa fa-edit"></i>
                <i class="fa fa-trash-o"></i>
                </div>
            </li>
            <li>
                    <span class="handle">
                    <i class="fa fa-ellipsis-v"></i>
                    <i class="fa fa-ellipsis-v"></i>
                    </span>
                <input type="checkbox" value="">
                <span class="text">Any other Activity</span>
                <small class="label label-primary"><i class="fa fa-clock-o"></i> 1 week</small>
                <div class="tools">
                <i class="fa fa-edit"></i>
                <i class="fa fa-trash-o"></i>
                </div>
            </li>
            <li>
                    <span class="handle">
                    <i class="fa fa-ellipsis-v"></i>
                    <i class="fa fa-ellipsis-v"></i>
                    </span>
                <input type="checkbox" value="">
                <span class="text">Any other Activity</span>
                <small class="label label-default"><i class="fa fa-clock-o"></i> 1 month</small>
                <div class="tools">
                <i class="fa fa-edit"></i>
                <i class="fa fa-trash-o"></i>
                </div>
            </li>
            </ul>
        </div>
        <!-- /.box-body -->
        <div class="box-footer clearfix no-border">
            <button type="button" class="btn btn-default pull-right"><i class="fa fa-plus"></i> Add item</button>
        </div>
        </div>
        <!-- /.box -->
    </section>
    <!-- right col -->
    </div>
    <!-- /.row (main row) -->
</section>

<!-- Morris.js charts -->
<script src="bower_components/raphael/raphael.min.js"></script>
<script src="bower_components/morris.js/morris.min.js"></script>
<script>
  $(function () {
    "use strict";
    //DONUT CHART
    var donut = new Morris.Donut({
      element: 'sales-chart',
      resize: true,
      colors: ["#3c8dbc", "#f56954", "#00a65a"],
      data: [
        {label: "Registered Doctors", value: @Model.doctors_count},
        {label: "Registered Nurses", value: @Model.nurses_count},
        {label: "Registered Patients", value: @Model.patients_count}
      ],
      hideHover: 'auto'
    });
  });
</script>
</body>
</html>
For populating above Page with real Data from DB you need to pass Data from Controller to View.
As a Best Practise, we’ll use ViewModel.
Create a new Folder as “ViewModels” & inside this Folder create a new file with the name “DashboardViewModel.cs”
& Add this Code:
namespace AdminPanelTutorial.Models
{
    public class DashboardViewModel
    {
        public int doctors_count { get; set; }
        public int nurses_count { get; set; }
        public int patients_count { get; set; }

    }
}
* Don’t forget to Update namespace here & in “Index.cshtml” File’s First Line According to your project’s namespace.
Now finally add this code to your “HomeController.cs”:
using System.Linq;
using AdminPanelTutorial.Models;
using Microsoft.AspNetCore;
using Microsoft.AspNetCore.Hosting;
using Microsoft.AspNetCore.Mvc;

namespace AdminPanelTutorial
{
    public class HomeController : Controller
    {
        private MyDbContext db = new MyDbContext();
        public IActionResult Index()
        {
            DashboardViewModel dashboard = new DashboardViewModel();

            dashboard.doctors_count = db.Doctors.Count();
            dashboard.nurses_count = db.Nurses.Count();
            dashboard.patients_count = db.Patients.Count();

            return View(dashboard);
        }
    }
}
Run your Application & you’ll see this page.
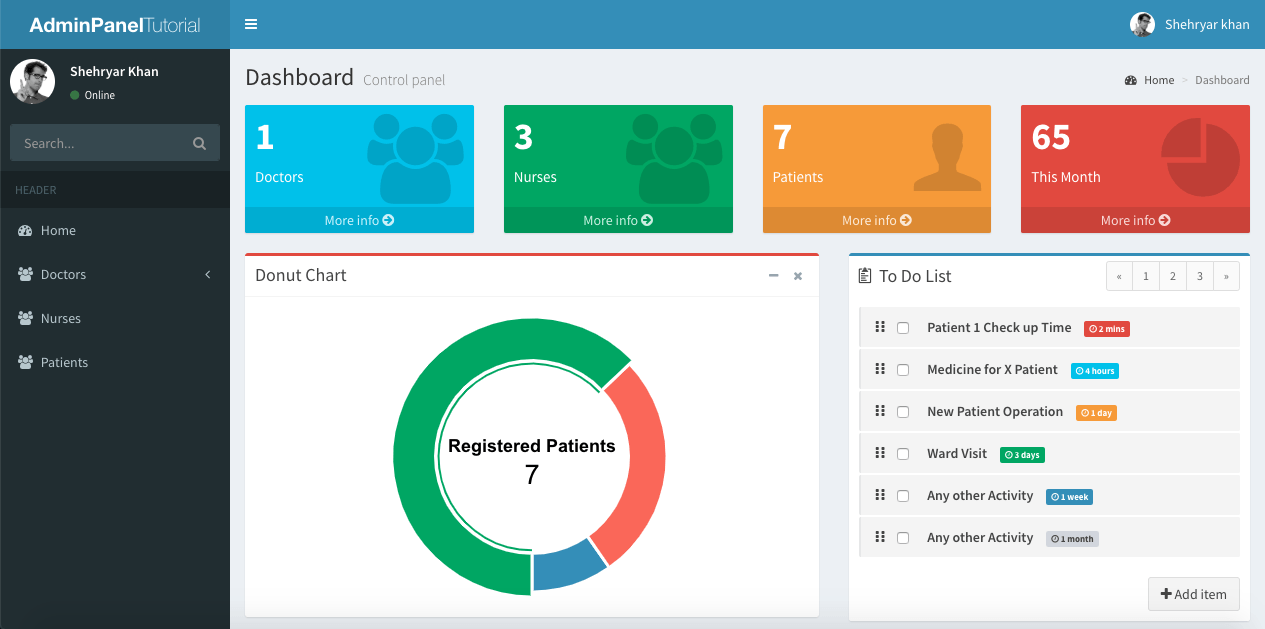
I’m just getting Doctors, Nurses & Patients count & displaying in my Dashboard as an example, you can Create ViewModel according to your Dashboard Design.
Running your project, you’ll see your Dashboard with real Doctors, Nurses & Patients count.
* Explore the AdminLTE Template to design your more Interactive Dashboards. Your Application can have more than one Dashboard.
Comment below If you find any difficulty or If you find this tutorial helpful.


Hello, i am searching for role based user authentication in asp.net core project if possible with angular 6/7 . can you help
Three notes
1) Is with ~/:
2) In MVC is very important use @RenderSection(“Scripts”, required: false) in _layout. This enclose Scripts in pages as @section scripts{ … }, in strict order
3) I used Pomelo.EntityFrameworkCore.MySql and ASP.NET Core. Works fine.
Regards
Assalam aalykum bhai….
great work…
hello. i am from poland. i uwielbiam was!