K-Modes Clustering For Categorical Data in Python
We use K-Modes clustering to partition a dataset with categorical attributes into different clusters. In this article, we will discuss the implementation of k-modes clustering for categorical data in Python. We will also discuss the elbow method to decide the appropriate number of clusters in k-modes clustering.
What is K-modes Clustering?
K-Modes clustering is a partitioning clustering technique just like K-Means clustering. While K-Means clustering works on numerical data, K-Modes clustering is used for clustering categorical data.
In K-Modes clustering, we first specify K centroids randomly for K clusters. After that, we assign the data points in the dataset to the clusters based on their dissimilarity from the centroid. The algorithm for determining the dissimilarity between two data points has already been discussed in the article on K-Modes clustering with a numerical example. After determining initial clusters, we use the mod of the values of attributes in a cluster to calculate a new centroid for the cluster. Then, we reevaluate the dissimilarity of the data points to the newly created centroids. After this, we reassign the data to different clusters. This process is continued until the clusters do not change in two consecutive iterations.
If you don’t have a clear idea of k-modes clustering, I suggest you read this article on K-Modes clustering with a numerical example. The article discusses the basics of k-modes clustering with a running example that will make you understand the process in a better way.
K-Modes Clustering Implementation For Categorical Data in Python
To implement the K-Modes clustering algorithm in Python, we will use the following dataset.
| Student | Subject 1 | Subject 2 | Subject 3 | Subject 4 | Subject 5 |
| Student 1 | A | B | A | B | A |
| Student 2 | A | A | B | B | A |
| Student 3 | C | C | B | A | C |
| Student 4 | C | A | B | B | A |
| Student 5 | B | A | A | B | C |
| Student 6 | A | B | B | A | C |
| Student 7 | B | A | C | C | C |
| Student 8 | A | A | A | A | A |
| Student 9 | A | C | B | B | B |
| Student 10 | A | B | B | A | A |
| Student 11 | C | C | D | B | A |
| Student 12 | A | C | B | B | C |
| Student 13 | A | B | A | C | B |
| Student 14 | B | C | C | D | B |
| Student 15 | A | B | B | B | B |
You can download the csv file of the dataset from the link given below.
Installation of kmodes Module
You can implement k-modes clustering using the kmodes module in Python. To install the kmodes module you can execute the following command in the command prompt.
pip3 install kmodesIf you don’t have PIP installed on your machine. In such a case, the above statement won’t work. You need to install pip using the following command.
py -m pip install --upgrade pipOn a Linux machine, you can use the following command to install PIP.
python3 -m pip install --upgrade pipAfter installing pip, you can install the kmodes module.
The KModes() Function
To implement K-modes clustering in Python, we will use the KModes() function defined in the kmodes module. It has the following syntax.
KModes(n_clusters=8, max_iter=100, cat_dissim=<function matching_dissim at 0x7f94a8dd1360>, init='Cao', n_init=10, verbose=0, random_state=None, n_jobs=1)Here,
- The
n_clustersparameter is used to specify the number of clusters in which you have to partition the dataset. It has a default value of 8. - The resultant clusters in K-Modes clustering are dependent on the initial centroids. So, every time we perform clustering, the resultant clusters are different. This is due to the reason that the initial centroids are selected randomly. For the best results, we need to perform clustering repeatedly using different centroids. To specify how many times you want to run the clustering algorithm to produce the results, you can use the
n_initparameter. The default value for then_initparameter is 10. Aftern_initexecutions, we select the execution having the best results. - In each execution of the K-Modes clustering algorithm, we use various iterations to get a stable cluster. The
max_iterparameter is used to specify the maximum number of iterations in a single execution. Its default value is 100. - The
cat_dissimparameter is used to specify the function to calculate dissimilarity between categorical variables. - The
initparameter is used to specify the method of initialization for initial cluster centroids. - The
verboseparameter is used to execute the function in verbose mode. By default, it is set to 0. You can specify any non-zero value in theverboseparameter to execute the function in verbose mode. - The
n_jobsparameter is used to execute different runs of the algorithm parallelly. By default, then_jobsparameter has the value 1. Hence, it executes all the runs of the algorithm one by one. For parallel execution, you can specify the number of executions to run parallelly. If you are not executing any other program, you can usen_jobsequal to the number of cores in your CPU for maximum efficiency.
Implement K-Modes Clustering For Categorical Data Using the kmodes Module in Python
Now that we have discussed the algorithm and function for K-Modes clustering, let us implement it in Python.
- First, we will import the necessary modules such as
pandas,numpy, andkmodesusing theimportstatement. - Next, we will load the dataset file using the
read_csv()function in the pandas module. Theread_csv()function takes the file name as its input argument and returns a pandas dataframe containing the data. Here, we will also use theindex_colparameter of theread_csv() function to specify that the Student IDs are identifiers for the rows and not the actual data. - After reading the dataset, we will use the
KModes()function to create an untrained machine learning model for K-Modes clustering. Here, we will pass the value 3 to then_clustersparameter to create a model that divides the input data into three clusters. After execution, theKModes()function returns an untrained model. - We will train the machine learning model using the
fit()function. Thefit()function, when invoked on an untrained model, takes a dataframe or numpy array containing data as its input argument and returns a trained machine learning model. - After fitting the model, we can use the
predict()method to predict clusters for any given data. Thepredict()function, when invoked on a trained machine learning model, takes a list containing the input data points. After execution, it returns an array containing the cluster number for each input data point.
You can observe the entire process in the following example.
from kmodes.kmodes import KModes
import pandas as pd
import numpy as np
data=pd.read_csv("KModes dataset.csv", index_col=["Student"])
untrained_model=KModes(n_clusters=3, n_init=4)
trained_model=untrained_model.fit(data)
clusters=trained_model.predict([['A', 'B', 'A', 'B', 'A'],
       ['A', 'A', 'B', 'B', 'A']])
print(clusters)
Output:
[0 0]In the above example, we have predicted cluster for two inputs after training the model using the fit() method.
Instead of predicting clusters for new data points, If you want to determine the cluster number for each cluster in the input dataset only, you can use the fit_predict() function instead of the fit() and the predict() function.
The fit_predict() function, when invoked on an untrained model, takes a dataset as its input argument. It trains the model using the input data and then predicts the cluster number for each data point in the dataset. After execution, it returns a numpy array containing cluster numbers for each data point in the training dataset. You can observe this in the following example.
from kmodes.kmodes import KModes
import pandas as pd
import numpy as np
data=pd.read_csv("KModes dataset.csv", index_col=["Student"])
untrained_model=KModes(n_clusters=3, n_init=4)
clusters=untrained_model.fit_predict(data)
print(clusters)
Output:
[0 0 1 0 0 1 0 0 0 0 0 1 2 1 0]Here, the training data contains 15 data points. Hence, the fit_predict() method returns a list containing 15 elements. Element at each position in the output list denotes the cluster to which the corresponding data point at the same position in the dataset belongs to.
In the above example, we have partitioned the dataset into 3 clusters. However, we don’t know if we have the optimal number of clusters. To determine the optimal number of clusters in K-Modes clustering for categorical data, you can use the elbow method.
Elbow Method to Find the Optimal Number of Clusters in K-Modes Clustering
In K-Modes clustering, we first need to know the optimal number of clusters. For this, we can use the elbow method.
We start with a single cluster and calculate the cost. Here, the cost is the sum of all the dissimilarities between the data points in the clusters. As we increase the number of clusters, the cost decreases rapidly. However, after a certain number, the cost becomes almost constant. This point denotes the optimal number of clusters. The graph of this entire process looks like a bent arm where the point denoting the optimal number of clusters looks like the elbow of the hand. Hence, the approach is termed the Elbow method.
We will use the elbow method to find the optimal number of clusters using the following approach.
First, we will define an empty list named costs to store the cost for each k. Then, we will train the machine learning model using different values of k starting from 2 to 10. After training the model, we will obtain the cost for the current model using the cost_ attribute of the model. We will append the cost to the costs list. Finally, we will plot the cost for each k and determine the optimal number of clusters.
from kmodes.kmodes import KModes
import pandas as pd
import numpy as np
import matplotlib.pyplot as plt
data=pd.read_csv("KModes dataset.csv", index_col=["Student"])
costs=[]
K=range(2, 10)
for k in K:
    untrained_model=KModes(n_clusters=k, n_init=4)
    trained_model=untrained_model.fit(data)
    costs.append(trained_model.cost_)
plt.plot(K, costs, 'bx-')
plt.xlabel('No. of clusters')
plt.ylabel('Cost')
plt.title('Elbow Method For Optimal k')
plt.show()
Output:
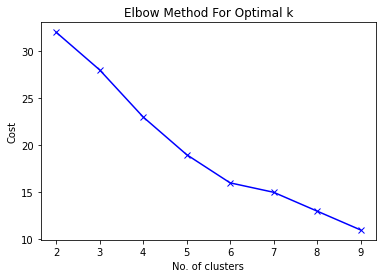
In the above image, you can observe that we haven’t been able to find an optimal number of clusters. At K=6, we get an elbow-like structure. However, the rate of decrease in cluster variance is significant even after this point. K=6 might be the optimal number of clusters. However, we cannot rely on this analysis completely.
To select the best k for k-modes clustering without confusion, you can read this article on the silhouette score approach for k-modes clustering in python.
Points to Remember While using K-Modes Clustering
- The input dataset in K-Modes clustering contains categorical data. Therefore, make sure that the data type of the values in each attribute is consistent with other attributes. Otherwise, the program may run into errors. You can specify the data type of all the attributes while data preprocessing.
- If there are multiple attributes and the dataset is very large. The algorithm may fail to initialize clusters. In such a case, you should first explore the data and check for outliers and distribution of the dataset. You might need to perform data cleaning to normalize the data. You can also choose to work with a lower number of clusters.
- The output of the K-Modes clustering algorithm is highly dependent on the initial centroids of the clusters. Hence, you might get different results for different executions. There is nothing to worry about that.
- The K-Modes clustering algorithm allows you to choose the initial centroids. You can warm-start the choice of centroids in a manner that suits the distribution of values in the dataset to minimize computation.
- The maximum dissimilarity score between two data points is equal to the number of features in the dataset. Hence, it is very likely that a data point has the same dissimilarity score for two or more centroids. In such a case, we need to define a mechanism to select the centroid to which the data point will be assigned.
- Before clustering, you must find the optimal number of clusters to be formed using the elbow method or the silhouette coefficient approach.
Conclusion
In this article, we have discussed the implementation of K-Modes clustering for categorical data in Python. We have also discussed the elbow method to find the optimal number of clusters while clustering.
To learn more about machine learning, you can read this article on regression in machine learning. You might also like this article on polynomial regression using sklearn in python.
To read about other computer science topics, you can read this article on dynamic role-based authorization using ASP.net. You can also read this article on user activity logging using Asp.net.