Agglomerative Clustering Numerical Example, Advantages and Disadvantages
Clustering algorithms play an important role in tasks like customer segmentation. In this article, we will discuss agglomerative clustering with a numerical example. We will also discuss its advantages, disadvantages, and applications.
What is Agglomerative Clustering?
Agglomerative clustering is an unsupervised machine-learning algorithm that groups data into clusters. It is a bottom-up approach hierarchical clustering approach, where each data point is assigned to its own cluster and then clusters are merged as the algorithm progresses.
Each cluster in agglomerative clustering is formed using the distance between the data points, which can be calculated using various techniques such as Euclidean distance or Manhattan distance. The algorithm starts by assigning each data point to its own cluster. Then, the algorithm looks for the two closest clusters and joins them into a single cluster. This process is repeated until all points are grouped into one cluster or until the desired number of clusters is achieved.
Agglomerative clustering is a useful approach that can help identify patterns in a dataset and group data points into meaningful clusters. It is often used for exploratory data analysis, customer segmentation, and feature extraction.
Agglomerative Clustering Algorithm
Following are the steps in agglomerative clustering.
- We start by assigning each data point to its own cluster.
- Next, we compute the distance between each pair of clusters and select the pair of clusters with the smallest distance.
- Then, we merge the pair of clusters with the smallest distance into a single cluster and update the distance between the newly formed cluster and every other cluster.
- We repeat steps 2 and 3 until all data points are in one cluster.
Calculation of Distance Between Two Clusters
The distance between clusters in agglomerative clustering can be calculated using three approaches namely single linkage, complete linkage, and average linkage.
- In the single linkage approach, we take the distance between the nearest points in two clusters as the distance between the clusters.
- In the complete linkage approach, we take the distance between the farthest points in two clusters as the distance between the clusters.
- In the average linkage approach, we take the average distance between each pair of points in two given clusters as the distance between the clusters. You can also take the distance between the centroids of the clusters as their distance from each other.
You can read more about this in this article on how to create a dendrogram in Python.
Agglomerative Clustering Numerical Example
To solve a numerical example of agglomerative clustering, let us take the points A (1, 1), B(2, 3), C(3, 5), D(4,5), E(6,6), and F(7,5) and try to cluster them.
To perform clustering, we will first create a distance matrix consisting of the distance between each point in the dataset. The distance matrix looks as follows.
| A | B | C | D | E | F | |
| A | 0 | 2.236068 | 4.472136 | 5 | 7.071068 | 7.211103 |
| B | 2.236068 | 0 | 2.236068 | 2.828427 | 5 | 5.385165 |
| C | 4.472136 | 2.236068 | 0 | 1 | 3.162278 | 4 |
| D | 5 | 2.828427 | 1 | 0 | 2.236068 | 3 |
| E | 7.071068 | 5 | 3.162278 | 2.236068 | 0 | 1.414214 |
| F | 7.211103 | 5.385165 | 4 | 3 | 1.414214 | 0 |
To create the above table, we have used euclidean distance.
After calculating the distance matrix, we will start clustering the data points using the single linkage approach.
Step 1: First, we will consider each data point as a single cluster. After this, we will start combining the clusters.
Step 2: To combine the individual clusters, we can consider the following points.
- Point A is closest to point B.
- Point B is at a similar distance to points A and C.
- Point C is closest to point D.
- Point D is closest to point C.
- Point E is closest to F.
- Point F is closest to E.
From the above points, we can combine (C, D) and (E, F) as clusters. We will name them CD and EF respectively. As we have ambiguity for points A and B, let us not combine them and treat them as individual clusters.
Step 3: Now, we will calculate the minimum distance between clusters A, B, CD, and EF. You can observe that
- Cluster A is closest to B.
- Cluster B is closest to A as well as CD.
- Cluster EF is closest to CD.
Using the above information let us combine B and CD and name the cluster BCD.
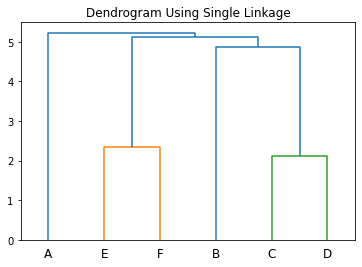
Step 4: After this, The cluster BCD is at the same distance from A and EF. Hence, we will first merge BCD and EF to form BCDEF.
Step 5: Finally, we will merge A and BCDEF to form the cluster ABCDEF. Using the above steps, we will get the following dendrogram.
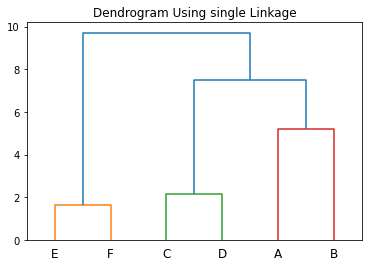
In the above example, if we combine (A, B), (C, D), and (E, F) together in step 2 above, we will get clusters AB, CD, and EF.
Now, The minimum distance of CD is the same from AB and EF. Let us merge AB and CD to form ABCD first. Next, we will combine ABCD and EF to obtain the cluster ABCDEF.
As a result, we will get the following dendrogram.
Instead of combining AB and CD in the previous example, let us first combine CD and EF to form CDEF. Then, we can combine AB with CDEF to form the cluster ABCDEF. As a result, we will get the following dendrogram.
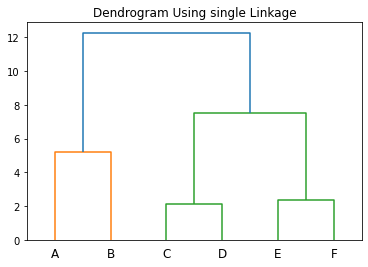
In the above example, there are many alternative paths at different steps. Due to this, we have obtained different dendrograms. Here, we have only used single linkage to calculate the clusters. Instead of the single linkage approach, you can also use complete linkage and average linkage approaches that might give you different clusters for the same dataset as well.
Why Does Agglomerative Clustering Give Different Clusters and Dendrograms?
Agglomerative clustering gives different clusters for two reasons.
- First, it is a greedy algorithm. Therefore, it looks for the closest clusters to combine them. Now, if cluster C is at the same distance with different clusters A, B, D, and E, the algorithm can merge C into any of these clusters and form one of the clusters AC, BC, CD, and CE. Therefore, the availability of alternative paths while merging the clusters gives us different dendrograms and different clusters as well.
- The algorithm can select any metric among single linkage, complete linkage, and average linkage as the distance metric to calculate the distance between the clusters. If we take different distance metrics in different runs of the algorithm, we will get different dendrograms and different clusters as well.
Advantages of Agglomerative Clustering
Agglomerative clustering has many advantages. Some of them are listed below.
- Agglomerative clustering is simple to implement and easy to interpret. You can implement it very easily in programming languages like python.
- It is a bottom-up approach that produces a hierarchical structure of clusters. So, you can choose any level of hierarchy to select a suitable number of clusters. Hence, it allows the clusters to build up from individual elements to the desired level of granularity.
- Agglomerative clustering is robust to noise and outliers. As the clusters are derived by combining the nearest clusters into one, the outliers will always stay in a different cluster and will not affect other clusters.
- The algorithm does not require any assumptions about the structure of the data or the number of clusters. It can be used with different types of data such as numerical, categorical, and binary. You can take any dataset and define a distance metric between the data points to calculate the distance matrix. After that, you can use the distance matrix to perform clustering as usual.
- It can be used for datasets of any size. Agglomerative clustering is a scalable algorithm. You can use it for 10 data points as well as 10 million data points. It is computationally efficient and scalable in both cases.
- Agglomerative clustering can be used with a variety of distance or similarity metrics. As the clustering algorithm uses the distance matrix for calculating clusters at each step instead of the actual data points, you can define ant distance or similarity metric to calculate the distance matrix.
- Agglomerative clustering is capable of producing clusters with non-convex shapes. It can identify clusters of different shapes and sizes.
- It is well-suited for exploratory data analysis and is well-suited for finding natural clusters in a dataset.
Disadvantages of Agglomerative Clustering
- It is difficult to determine the right number of clusters in agglomerative clustering. While the clustering process produces clusters in a hierarchical manner, you might find it difficult to choose the granularity level to select the right number of clusters.
- It can be difficult to interpret the results of clustering. If you don’t have an understanding of the dataset and domain knowledge, you won’t be able to what features the clusters at each level have.
- Agglomerative clustering may not produce the same results each time. As shown in the numerical example discussed above, different distance measures produce different results in agglomerative clustering. Even the approach using the same distance measure can create different clusters in different executions.
- Agglomerative clustering is not very suitable for high-dimensional data and data with non-convex shapes.
- Agglomerative clustering does not consider the intrinsic properties of the data. It just uses the distance between the data points to group them into clusters.
- Agglomerative clustering is not suitable for classifying data with overlapping clusters. It doesn’t take into account the relationship between the clusters.
- Agglomerative clustering isn’t suitable for data with different densities, variances, and shapes. Sometimes, it might also be difficult to decide on the right linkage criteria for clustering.
- Agglomerative clustering is a greedy algorithm. It always takes the nearest clusters to combine them into bigger clusters. Hence, it might not always produce the best results with optimal clusters.
- There is no guarantee that the resulting clusters in agglomerative clustering are meaningful. The algorithm does not provide any probabilistic guarantees about the quality of the clusters.
Applications of Agglomerative Clustering
- Market segmentation: Agglomerative clustering can be used to segment customers into distinct market segments. As it produces hierarchical clusters, we can group the customers into clusters at different levels to make policies and customer outreach programs to increase sales and customer satisfaction. We can also use it to group customers into distinct segments based on their behaviors and preferences.
- Image segmentation: Agglomerative clustering can be used to identify and segment objects within an image.
- Text clustering: Agglomerative clustering can be used to group related documents together. Documents of a similar kind when turned into word embeddings have the least distance between them. Hence, we can cluster the documents based on the distance of word embedding vectors using agglomerative clustering. It can also be used to recognize and classify speech patterns.
- Social network analysis: It can identify communities within a social network.
- Medical diagnosis: We can use agglomerative clustering to identify clusters of individuals with similar symptoms or medical conditions. It can also be used to identify gene clusters with similar expression patterns.
- Anomaly detection: Agglomerative clustering can be used to identify outliers in a dataset.
Conclusion
In this article, we have discussed agglomerative clustering, its advantages, disadvantages, and applications. We have also discussed a numerical example of agglomerative clustering.
To learn more about machine learning, you can read this article on regression in machine learning. You might also like this article on polynomial regression using sklearn in python.
To explore data visualization, you can have a look at this article on how to avoid chart junk.
I hope you enjoyed reading this article. Stay tuned for more informative articles.
Happy Learning!